

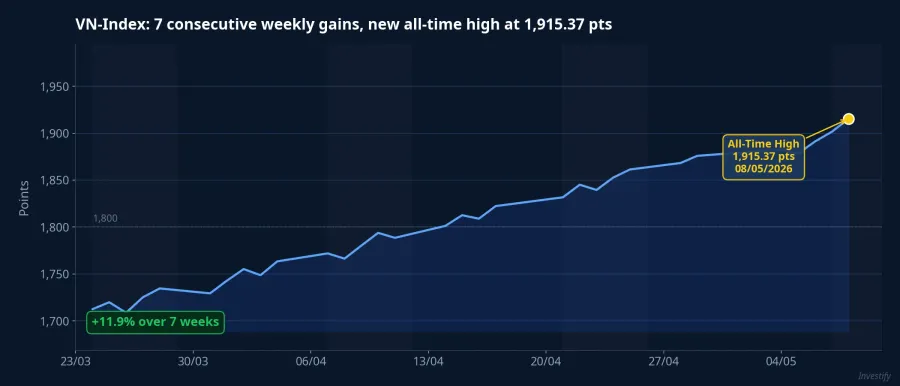
On 8 May 2026, VN-Index closed at 1,915.37 points, a new all-time high.Vietstock On the same day, 210 stocks declined on HOSE against only 95 advancers. Across the full week of 5–9 May, only Tuesday's session had breadth leaning positive. Three of the four sessions saw decliners dominate by a wide margin, while foreigners extended their net-selling streak to 12 consecutive sessions since 17 April.CafeF
The most common question across retail investor communities: is VN-Index forming a distribution top?
The logic behind that concern is internally consistent. When foreign institutions sell steadily across multiple sessions, they may know something retail investors do not. When the index breaks a record on weakening breadth, the rally is being driven by a narrow group of stocks. If that group runs out of steam, there is nothing underneath to hold the index up. In technical analysis, a prolonged breadth divergence coinciding with new index highs is indeed one of the textbook signs of a distribution phase. That said, a textbook pattern is not a conclusion. It takes more layers of data to reach a verdict.
Foreign Flow: Rotation, Not Retreat
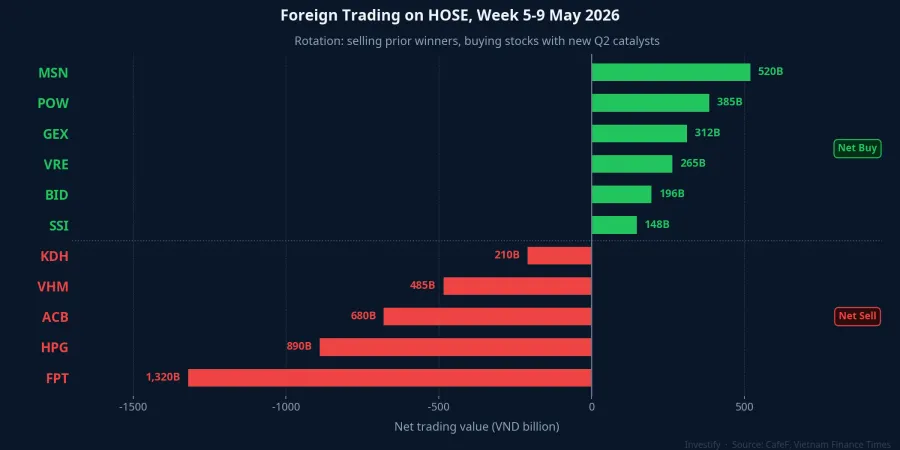
For the week of 5–9 May, foreign investors net-sold VND 4,250 billion-plus on HOSE.CafeF At face value, that number supports the distribution narrative. But when you break the flow down stock by stock, the picture changes.
Top net buyers for the week were MSN, POW, GEX, VRE, BID, and SSI.Vietnam Finance Times Top net sellers were FPT, ACB, HPG, KDH, and VHM. Two very distinct groups. The names being sold are stocks that rallied hard in the previous leg and have largely priced in their good news. The names being bought each carry a specific Q2 catalyst: MSN just posted its highest Q1 profit in company history on the back of WinCommerce turning profitable, POW benefits from power infrastructure spending, GEX and its Gelex affiliates are directly in the power infrastructure theme, and VRE moves with VHM's earnings cycle.
This is the signature of portfolio rotation: selling what has already priced in its story, buying what still has a catalyst ahead. A fund exiting the market sells everything across the board and wires money home. That is not what happened this week.
Why Foreigners Are Selling: Three Structural Pressures
The broad reason foreigners have been net sellers does not stem from a negative view on Vietnam. Research from SHS, VNDIRECT, and VPBankS converges on three structural forces that are external to Vietnam's market story.
First, the exchange rate. The USD/VND rate has been holding at an elevated range of VND 26,330–26,350 per dollar.Vietnam Finance When the dong is weak, a foreign fund's USD-denominated returns erode even when stocks are rising in local currency terms. This naturally leads funds to throttle new deployment and reduce currency exposure. Second, FTSE repositioning. Some ETFs are rebalancing their portfolios ahead of Vietnam's anticipated inclusion in the FTSE Secondary Emerging Markets index in September 2026,24HMoney adjusting exposure before the new benchmark weights take effect. Third, USD interest rates. Elevated U.S. rates reduce the relative attractiveness of emerging market equities against risk-free dollar assets, keeping global funds in a defensive posture.
All three pressures will ease or disappear on their own timelines. None of them are driven by a deteriorating view of Vietnamese stocks.

The Narrow Leaders Have Real Catalysts
The more important question is: which stocks are pulling the index to an all-time high, and what is powering them?
On 7 May, VHM hit its daily upside limit tied to a VND 24,644 billion cash dividend with the record date approaching. GEX and GEE also closed limit-up the same session on power infrastructure investment news. STB set a historical closing high at VND 73,700 per shareVietstock as Sacombank's 10-year restructuring plan nears completion. Masan reported its highest Q1 net profit on record, with WinCommerce finally turning profitable and materially improving group-level margins.
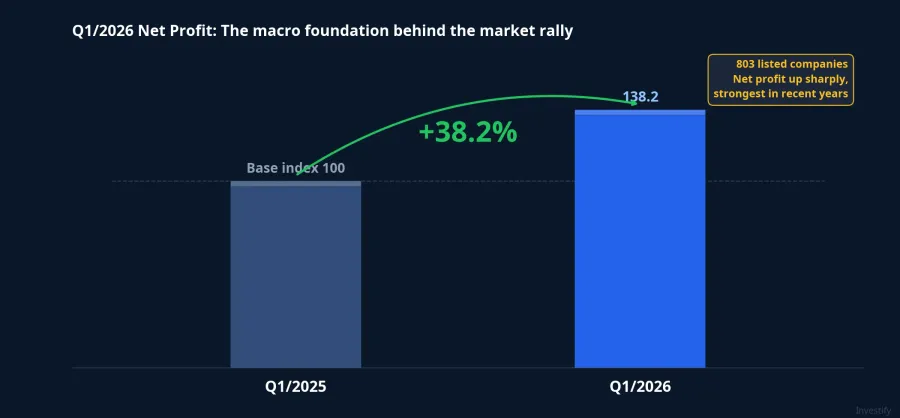
These are stock-specific events, not a general mood lift. The macro backdrop adds further support: aggregate data from 803 listed companies shows Q1/2026 net profit grew 38.2% year-on-year.VnEconomy This is earnings-driven support for valuations, not purely liquidity-driven.
Market Breadth: Where the Line Between Healthy and Risky Lies
When is a breadth divergence healthy, and when does it turn risky? The answer lies in the quality of the leading group, not in the count of advancing stocks.
A healthy divergence occurs when the large-cap leaders have specific catalysts, earnings fundamentals support their gains, and mid- and small-caps are only temporarily left out as capital concentrates ahead of a known event. That is the state of 5–9 May: VHM's dividend, Masan's record earnings, Gelex's power infrastructure theme, Sacombank's restructuring milestone — each a distinct catalyst, not a generalized sentiment wave.
A risky divergence occurs when the narrow leaders run out of new catalysts but keep dragging the index higher. At that point, the source of support becomes unclear and fragile.
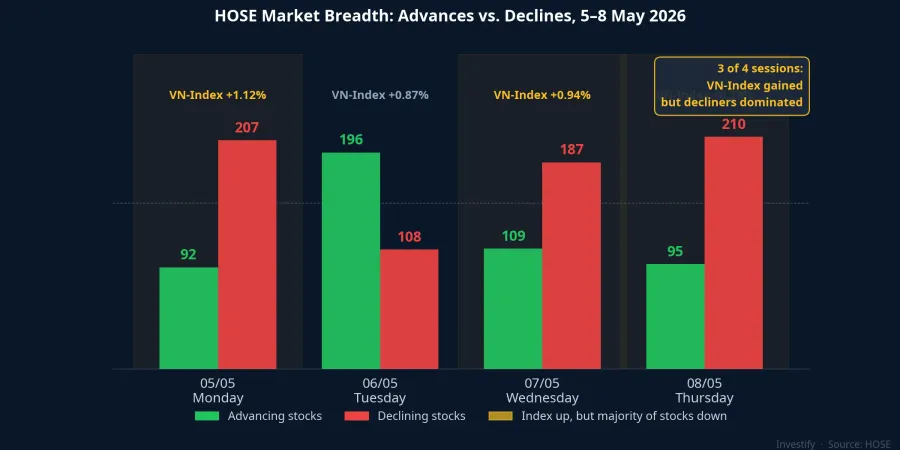
The transition is not a fixed point. Markets can sustain a healthy divergence for several more weeks if new catalysts keep arriving. What matters is not how many times divergence appears but whether the narrow leaders have genuine fundamental underpinning.
Two Signals to Watch
Reading the current state correctly is the starting point. Two signals will show when that state begins to change.
Signal one: whether foreigners continue buying MSN, POW, GEX, and VRE once the good news is fully priced in, or shift to selling those names along with the existing sell group. If the transaction structure moves from rotation to broad-based selling across the board, the nature of foreign flows has changed.
Signal two: whether market breadth improves when VN-Index retests the all-time high zone, particularly among mid-caps. If the next two sessions at peak levels still show decliners dominating, and the narrow leaders have no new events, the divergence is transitioning from healthy to concerning.
Until those signals appear, the divergence of 5–9 May should be read as evidence of a market selecting by fundamentals, not a market preparing to reverse. The strong Q1/2026 earnings cycle and the stock-specific events in the leading names are the real structural support, not a generalised sentiment wave.
For investors to consider: A common defensive positioning after seven consecutive up-weeks is to maintain moderate cash levels (15–25%), prioritize stocks that still have upcoming catalysts not yet priced in, and gradually reduce exposure in names that rallied strongly in the prior leg without a follow-on catalyst.