
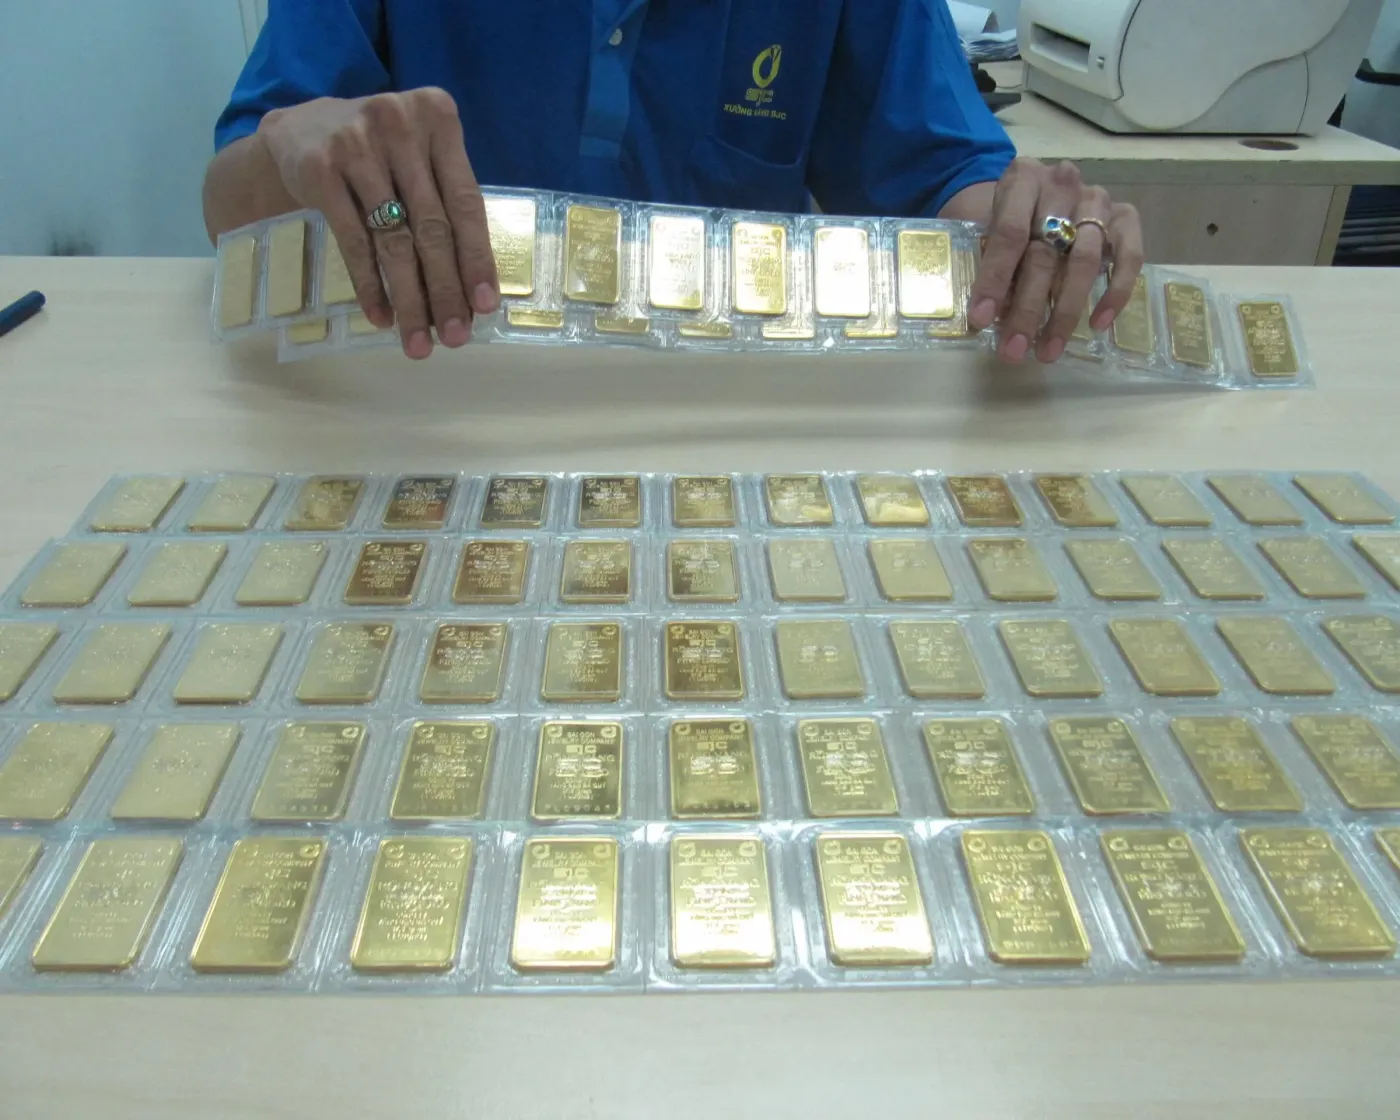

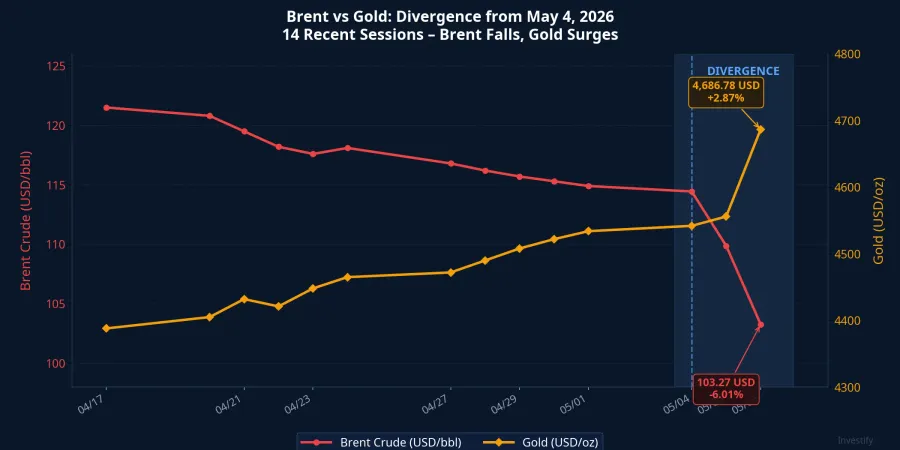
On the night of May 6, 2026, two numbers emerged from the same headline about the Middle East: Brent crude closed at USD 103.27 per barrel, down 6.01% in a single session. Spot gold settled at USD 4,686.78 per ounce, up 2.87%. Both moves were attributed to the same backdrop: the White House was reportedly negotiating a one-page memorandum of understanding with Iran to end hostilities and reopen the Strait of Hormuz.CNBC
The common investor reflex when reading this kind of news: Iran cools down, geopolitical risk falls, gold should follow oil lower. But the data from May 6 flatly contradicted that reflex.
This was not a paradox. It was a signal that gold and oil are responding to two fundamentally different types of risk. Investors have been watching the wrong channel.
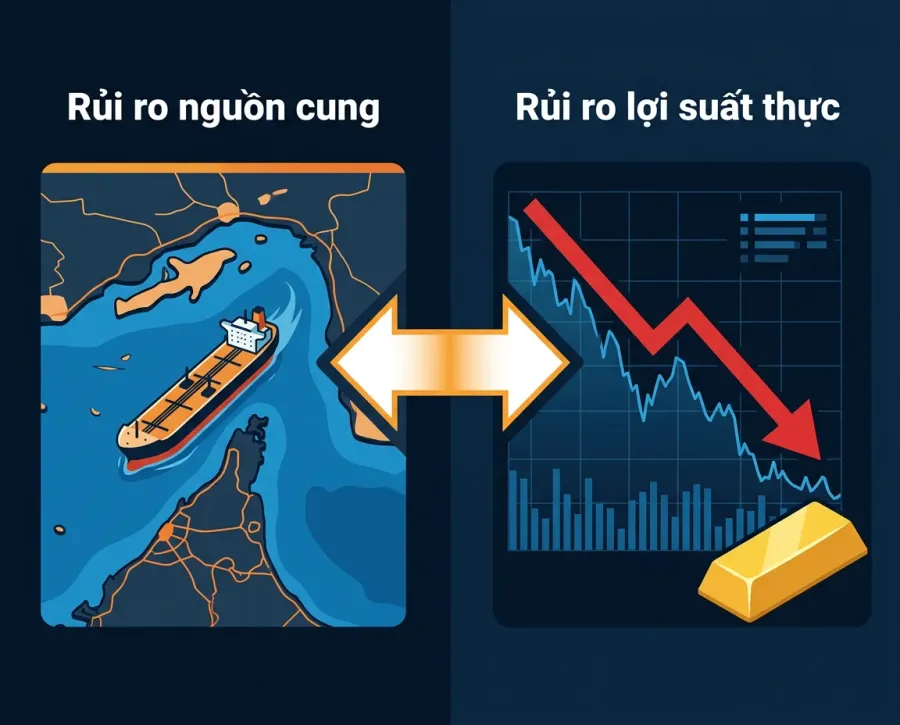
Two Risk Channels, Not One
When people talk about "safe-haven assets," they often lump gold and oil into the same basket. But the bigger picture reveals that these two assets respond to entirely different kinds of risk.
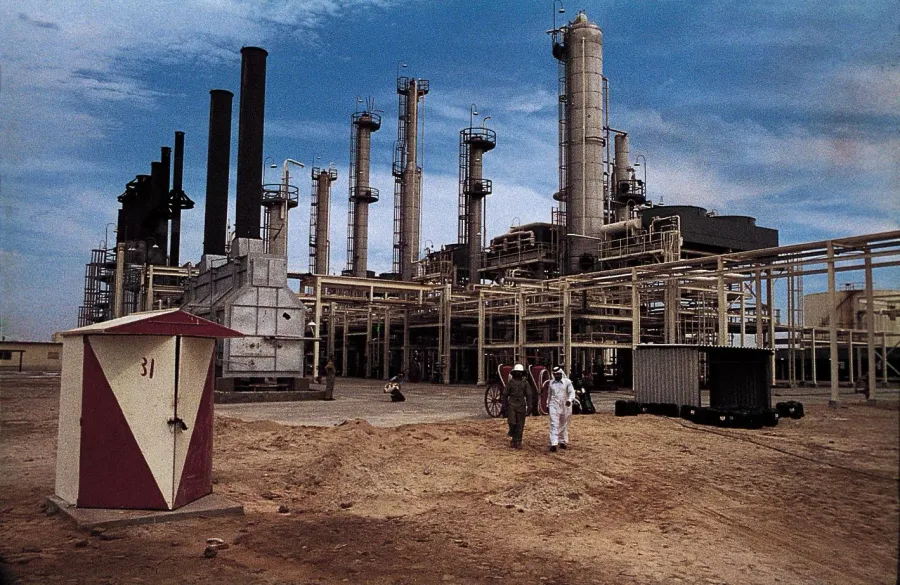
Brent crude tracks supply risk. The Strait of Hormuz carries roughly 20% of the world's daily oil supply. When Iran threatens to close the strait, markets price in the probability of a supply disruption and Brent rises; when the White House signals a peace memo, that probability falls and so does Brent. This is a direct, session-by-session relationship.
Gold tracks opportunity cost, specifically the real yield on U.S. Treasury bonds. Gold pays no interest; when Treasuries offer a high real yield, holding gold is expensive in terms of forgone income. When real yields are low, that cost shrinks and gold becomes more attractive. Geopolitical events only affect gold indirectly, by shifting inflation expectations or expectations about Fed policy, not directly.
On May 6, the Iran détente pulled Brent lower exactly as expected. But that very drop triggered a transmission chain that ran in the opposite direction to conventional thinking, pushing gold higher.
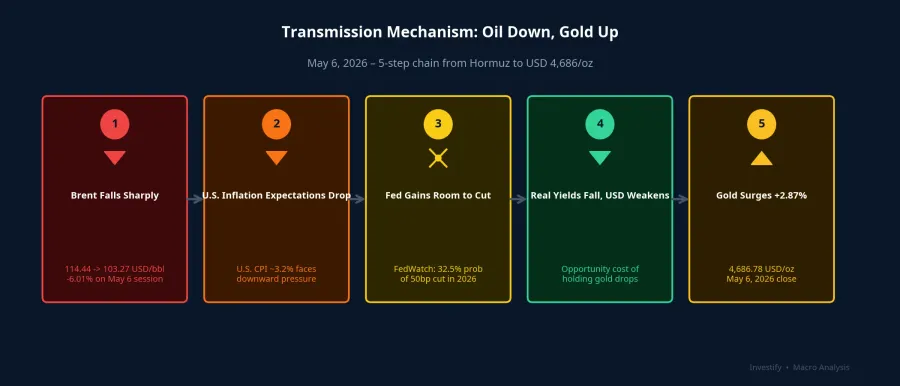
The Five-Step Chain from Hormuz to USD 4,686/oz
The data flow on the night of May 6 unfolded in five observable steps.
Step 1: Brent falls sharply. From USD 114.44 on May 4, Brent dropped to USD 103.27 on May 6, losing nearly 10% in just two sessions. This was not a routine technical pullback. It was a repricing of supply-disruption probability the moment White House peace signals hit the newswires.
Step 2: U.S. inflation expectations fall. Energy carries meaningful weight in the U.S. CPI basket. U.S. CPI has been running at approximately 3.2%, with energy prices as a key upward driver in recent months. When Brent drops nearly 10% over two sessions, markets reprice future inflation expectations lower, without waiting for official data releases.
Step 3: The Fed gains room to cut. Lower inflation expectations mean the Fed has more latitude to ease policy. According to CME Group's FedWatch tool, the probability of a 50-basis-point cut in 2026 stood at 32.5%, with a 75-basis-point cut priced at 25.9%. Both figures ticked higher within the session as the oil news spread.
Step 4: Real yields fall, the dollar weakens. Real yield equals nominal yield minus inflation expectations. When both legs decline as Fed easing expectations rise, real yields fall faster than nominal yields. The dollar also weakened as rate-cut odds increased, adding another tailwind for gold.
Step 5: Gold gains 2.87%. When the opportunity cost of holding gold falls and the dollar weakens simultaneously, gold benefits on both fronts. The May 6 close of USD 4,686.78 per ounce was not driven by war escalation; it was driven by peace-driven oil weakness opening the door for Fed easing.
The chart below illustrates the divergence between Brent and gold beginning around May 4, coinciding with the first Iran negotiation signals reaching markets. While Brent shed nearly 10% over two sessions, gold climbed from around USD 4,540 to USD 4,686.78 per ounce.
How Domestic Vietnamese Gold Prices Responded
The international gold rally transmitted directly into domestic prices. According to Thanh Niên, SJC gold bars closed May 6 at VND 163–166 million per tael (bid–ask), up VND 1 million per tael from the prior session. SJC gold rings settled at VND 162.5–165.5 million per tael, also up by the same amount.Thanh Niên
Notably, the USD/VND exchange rate remained virtually flat at VND 26,333 over the past two weeks. This means the entire May 6 domestic price increase was imported through the international channel, not driven by currency movement. The SJC premium over international gold prices remains elevated, but that is a structural, long-term story, not the driver behind the May 6 session.
Reading the Right Signal for Gold
The May 6 data points to a practical framework: when reading Middle East headlines to gauge gold's direction, the right question is not "Is Iran warming up or escalating?" It is "How does this news affect U.S. real yields and the dollar?"
Two contrasting scenarios are worth keeping in mind:
If Middle East tensions escalate and oil prices surge, U.S. CPI could be pushed higher, forcing the Fed to hold rates elevated for longer. Real yields rise, and gold faces opportunity-cost pressure, even if a short-term safe-haven reflex drives a brief rally. Two forces pulling in opposite directions. The net outcome is not predictable in advance.
If détente occurs and oil falls — as it did on May 6 — inflation expectations drop, the Fed gains room to ease, real yields decline, and gold gets clear support. This is the scenario the market executed on May 6.
In practice, Fed signals — monthly jobs data, CPI prints, Chair Powell's remarks — have a more direct and consistent impact on gold than Middle East developments across most ordinary sessions. The 10-year TIPS yield and daily DXY movements are the two indicators worth tracking consistently, more so than tallying the number of missiles fired.
For portfolio allocation, a 5–10% weighting in gold is a common hedging benchmark for Vietnamese retail investors. In the current context of an approaching Fed easing cycle, gold is performing its intended role: insurance against negative real yields and a weakening dollar.
Signals to Watch Over the Coming Weeks
The U.S. CPI report for May (expected in mid-June) will be the first hard data point revealing whether the oil-driven price decline has actually filtered into official inflation figures or has only moved short-term expectations. The FOMC meeting on June 16–17 will deliver a direct signal on rate-cut probabilities for the second half of the year. If the Fed moves sooner than currently expected, the real-yield channel will continue to support gold.
Two countervailing risks warrant parallel monitoring: if the Iran MOU collapses, Brent could rebound sharply and reverse the entire transmission chain. Conversely, if U.S. payroll data comes in unexpectedly strong, the Fed may push back on early easing expectations, and gold would face pressure from the other direction.
The May CPI release and the June FOMC decision are the two pivotal signals. The Fed and Hormuz threads will remain intertwined in the weeks ahead. Correctly identifying which channel is dominant at any given moment is the prerequisite for not being caught off guard at the next counterintuitive session.