
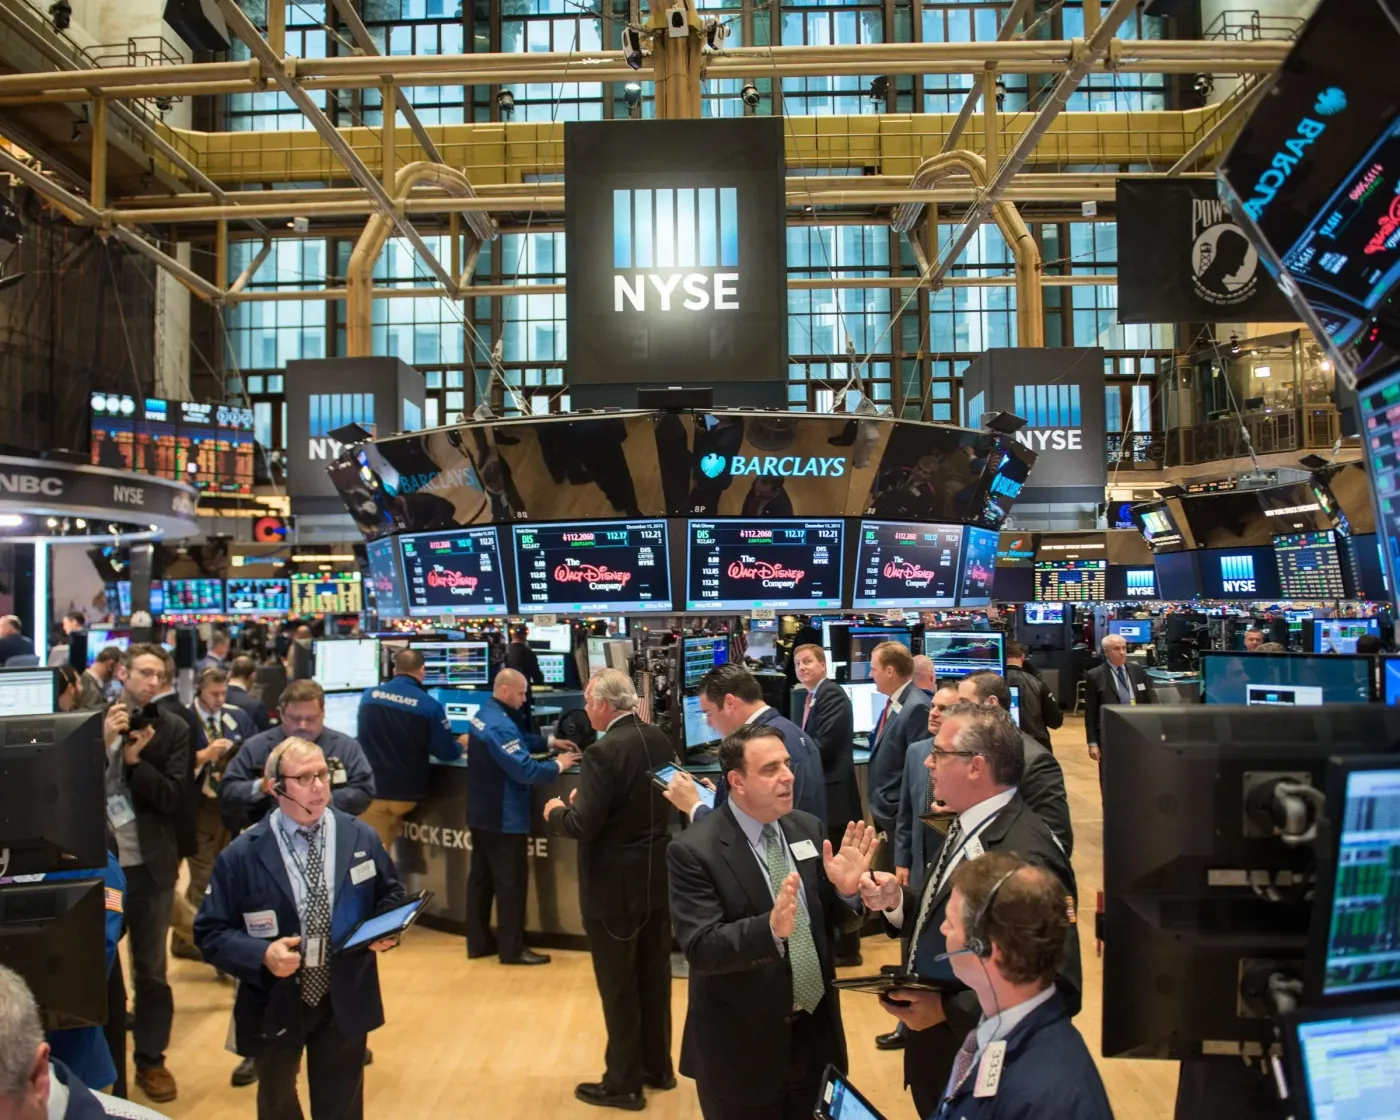

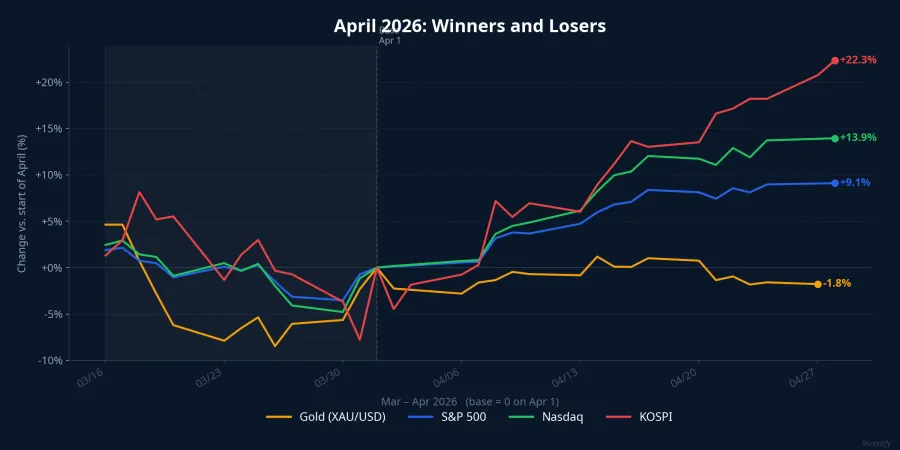
On April 27, the S&P 500 closed at 7,173.91 — a fresh all-time high driven by AI optimism and strong corporate earnings.Motley Fool The Nasdaq reached 24,887.10 the same day, up 13.5% since the start of the month. South Korea's KOSPI hit 6,701.59 on April 28, a 23.2% surge over 30 days.
Meanwhile, spot gold closed April 27 at $4,699.99/oz — down 2.51% from April 20. Two opposite directions, one month, one global financial system.
When VIX Tells the Story
The geopolitical backdrop in April gave gold plenty of reasons to rally. Brent crude jumped from $95.48 to $107.11/barrel in a single week — a 12.18% surge as US-Iran talks stalled and Strait of Hormuz closure risks escalated.Investify Under conventional wisdom, an oil spike paired with geopolitical risk should pull gold along for the ride. April 2026 rejected that logic.
The clearest signal came from VIX. By late April, the fear gauge had dropped to 18.02 — a 39.6% decline from a month earlier.Investify A near-40% drop in VIX over a single month is not a defensive posture. It is institutions actively rotating back into risk assets at speed.
Goldman Sachs attributed the gold correction to two forces: expectations that the Fed would hold rates higher for longer than previously forecast, and US economic data consistently beating consensus. Gold pays no yield; when real bond yields are elevated, every month spent holding gold is a month of foregone coupon income. The World Gold Council noted that central bank physical gold buying remained positive, but ETF outflows accelerated as institutional and retail investors rotated toward higher-return assets.
SPDR Gold Trust: Institutional Conviction
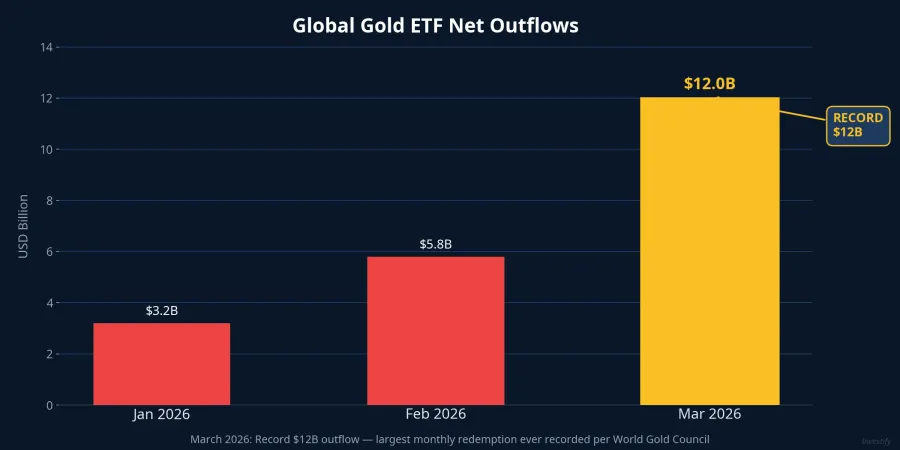
The most direct institutional signal came from SPDR Gold Trust (GLD) — the world's largest physically backed gold fund. On April 27 alone, GLD recorded net outflows of $390.07 million, one of the heaviest single-day redemptions of the month.Yahoo Finance This built on a remarkable March: global gold ETFs saw a record $12 billion in net outflows during March 2026, the largest monthly redemption ever recorded per World Gold Council data.World Gold Council
The picture was not uniformly bearish. Some weeks in early April saw inflows return to GLD, suggesting the market had not abandoned gold entirely. But the April 27 session — precisely when the S&P 500 hit its record — saw the clearest swing back to risk.
JPMorgan's assessment: gold's strong run earlier in the year left it vulnerable to profit-taking, especially as Fed rate-cut expectations were pushed back and US bond yields stayed elevated. The April pullback does not erase the structural case for gold — central bank accumulation continues globally. But it clarifies one thing: in April 2026's specific window, with AI driving a technology rally and US economic data supportive of risk appetite, institutions prioritized reducing gold exposure over adding to it.
The Strait of Hormuz Context

The fact that gold sold off even as Hormuz tensions pushed oil above $107/barrel is notable. It suggests the safe-haven bid for gold has become more conditional — triggered by acute financial stress (banking crises, credit seizures) rather than standard geopolitical noise. When VIX is at 18 and equity markets are making new highs, geopolitical risk alone is not sufficient to sustain a gold rally. This is a meaningful behavioral shift worth tracking.
Three Things Vietnamese SJC Holders Should Know
The SJC domestic market runs on its own rhythm. Local gold was priced at VND 168.8 million/tael on April 25, down approximately 3.5% from the April 8 peak of VND 175 million. Notably, the domestic market began correcting from mid-month — before the international spot move in the week of April 20-27 — illustrating that SJC does not track XAU/USD tick-for-tick.
The buy-sell spread at SJC remains VND 2.5 million/tael, roughly 1.5% round-trip. This spread is a silent cost that compounds when investors need to rotate positions quickly. SJC holders are also paying a premium above international spot equivalent — meaning total exposure includes both the XAU/USD price and a domestic liquidity premium.
Opportunity cost is now concrete. Twelve-month deposits at major Vietnamese banks currently offer 5–5.5% annualized, with smaller banks and online platforms offering more. A month where gold drops approximately 3.5% plus foregone deposit interest creates a measurable gap versus the alternative.
Portfolio function matters more than price trend. Gold earns its place in a diversified portfolio as protection against tail risks — banking stress, currency crises, geopolitical shocks severe enough to disrupt financial markets. That role is legitimate. But the allocation should be sized to the hedge function, not built around the expectation of continued price appreciation. Most portfolio education frameworks suggest 5–10% in gold; exceeding that requires a specific reason, not just momentum from the prior rally.
The structural case is intact, but the near-term narrative has shifted. Central bank buying, geopolitical risk, and long-term dollar concerns still support gold over a multi-year horizon. What April demonstrated is that these factors do not automatically override the opportunity cost equation when risk assets are delivering strong returns.
What to Watch This Week
Three signals will shape gold's near-term direction:
First, does GLD reverse its outflow trend? ETF flow data will indicate whether the March-April redemption cycle was tactical profit-taking or a structural shift in institutional allocation.
Second, does the S&P 500 hold above 7,170 after Big Tech earnings on April 28-29? If technology companies deliver on elevated profit expectations, risk appetite stays supported and gold faces continued pressure. A miss could trigger defensive rotation back toward gold.
Third, does VIX climb back above 20? That threshold historically marks the shift from complacency to caution. A sustained move above 20 would likely bring systematic and defensive buyers back into gold.
These three datapoints — all resolving this week — will do more to clarify gold's next move than any chart pattern.