


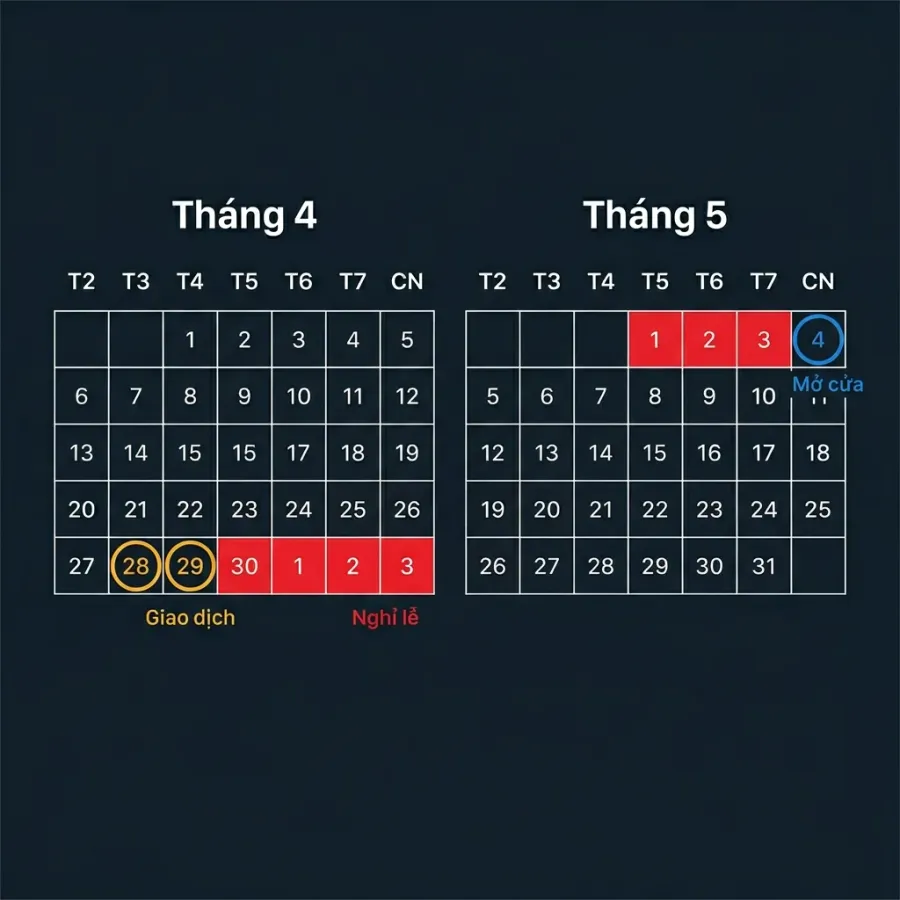
The big picture from the 24 April 2026 session is clear: the VN-Index lost 17.07 points to close at 1,853.29 (-0.91%), VHM fell 5.23% and dragged the VN30 basket red, and foreigners net-sold roughly VND 3,339 billion — the heaviest daily outflow in the last 20 sessions. None of that is the most interesting part. The interesting part is this: only two trading sessions remain — Tuesday 28 April and Wednesday 29 April — before HOSE, HNX and UPCOM close for four consecutive days for the Reunification Day and Labour Day holidays. During those four days, global news does not pause. The Fed meets in late April, the Strait of Hormuz is the most volatile variable in the oil market, and the foreign flow signal is shifting faster than it has in weeks.
The question retail investors have to answer over the next two sessions is not which stocks to pick. It is an allocation question.
The 24 April reversal: a pullback at a sensitive moment
After four consecutive up-sessions lifted the index to a short-term high of 1,870.36 on 23 April, Friday's reversal was orderly but decisive. Breadth tilted down with 141 gainers against 196 losers. Matched liquidity on HOSE dropped to 673.85 million units, well below the 1.02 billion units printed on 23 April. Total traded value across the market came in at roughly VND 19.35 trillion.
VHM was the epicentre of the VN30 pullback with a 5.23% decline — a sharp mirror to its 20 April session, when the same stock hit the ceiling at +6.93%. The VN30 closed at 2,011.42, down 13.32 points (-0.66%), with 8 advancers and 21 decliners. Large caps including VCB, SAB, PNJ and BID moved in the same direction and added weight to the pull. Information technology was the weakest sector of the session, while utilities, healthcare and communication services held green.
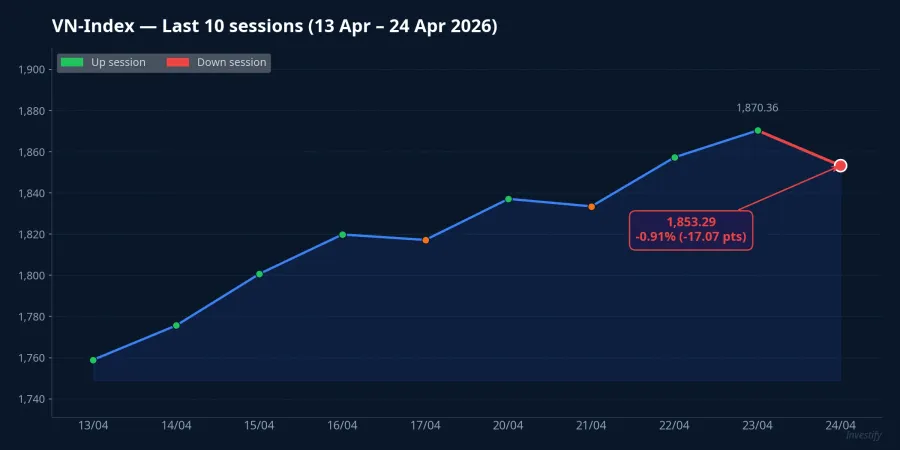
The notable thing about this pullback is not its size — 0.91% is a routine correction for a market sitting at a 10-session high. The notable thing is its timing. The reversal arrived right at the door of a four-day window during which Vietnam is closed while the rest of the world keeps trading. That is why the allocation decision before 30 April is not a price-prediction exercise. It is a portfolio-structure exercise.
Three macro pressures stacked on top of the 4-day break
The Strait of Hormuz is the largest single variable. Brent has climbed 17.1% in a week, from USD 90.38/barrel on 17 April to USD 105.85/barrel on 24 April — the energy market is pricing in fresh geopolitical risk at a fast clip. If the situation escalates during the four days Vietnam's market is shut, oil and aviation stocks will face opposing forces the moment trading resumes on 4 May. Any de-escalation signal can reverse that momentum just as quickly.

The Fed holds its late-April policy meeting inside the same cluster of days Vietnam is off. Market expectations currently lean toward holding rates, but any shift in the Chair's tone on the pace of the remaining 2026 cuts has the capacity to travel through DXY, the USD/VND rate (which stood at 26,322.5 on 22 April), and foreign flows on HOSE. These three channels are the primary transmission mechanisms into sentiment for the 4 May reopen.
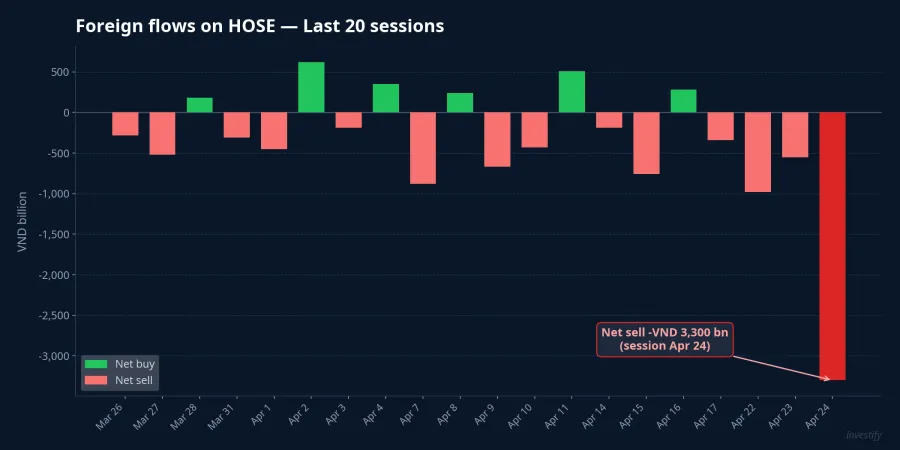
The third pressure is foreign flows themselves. On 24 April, foreigners net-sold roughly VND 3,339 billion — far above the 20-session average. This is not a one-session event: the net-selling streak has extended over several weeks with rising intensity, and the 24 April print is the clearest acceleration point of the run.
Five years of 30/4 holiday data: narrow range, no directional pattern
Looking at VN-Index behaviour across 2021–2025, the open-to-close gap after the 30 April break is narrow and does not repeat in a fixed direction. In 2021, the post-holiday open printed the clearest downside gap of the cohort, as the market reopened into a fresh COVID-19 wave. 2024 went the other way, with a small upside gap. Inside a ±4-session window around the break, the index typically trades in a tight range going in, and differentiates sharply on the reopen day.
The takeaway: the open-to-close spread across the last five holidays rarely exceeds 2% in either direction. Two implications follow. First, reopen downside risk is not large enough to justify blanket portfolio de-risking. Second, and symmetrically, there is no positive "holiday premium" embedded in simply holding full equity weight — the right answer depends on portfolio structure, not a single rule.
Three allocation paths for the 4-day pause
Under current conditions — Friday's 0.91% pullback, record foreign net selling, a 17.1% Brent move, and a Fed meeting landing inside the break — individual investors have three directions. Not three equivalent answers, but three points on a single allocation dial.
Hold current equity weight fits portfolios with long investment horizons that have already travelled through prior holiday windows. The opportunity cost is a possible negative gap on 4 May if the Fed leans hawkish or Hormuz escalates. The upside is not missing a cheap entry if positive news pushes the reopen higher. The 5-year data suggests the gap rarely exceeds 2%, so the downside is not symmetric with the expectation of a major correction.
Rotate a slice into short-duration fixed-income products fits investors who want a yield stream running during the four-day pause but retain flexibility to redeploy after the reopen. Short-tenor online deposits at private and digital banks are currently offering promotional rates for new funds. Money market funds and flexible certificates of deposit allow partial redemption with a sliding yield tied to actual days held. Specialised fixed-income products offer higher contractual yields than the deposit baseline, with a defined cash-flow structure. The trade-off is liquidity: early redemption generally accepts a lower effective rate, so only the portion of capital that will not be needed in the next 1–4 weeks belongs here.
Hold cash waiting for a post-holiday entry has the most transparent opportunity cost: four days without yield, and a missed entry if the 4 May session opens higher. This only makes sense when there is a concrete buy plan tied to a target price — not as a vague "wait for the market to tell me" stance.
What investors can consider
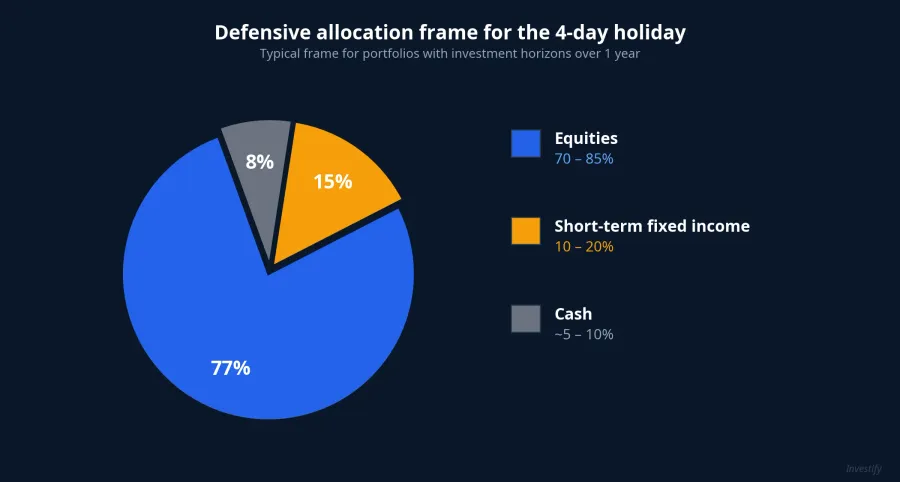
For most portfolios with horizons beyond one year, the common defensive frame sits around 70–85% equities, with 10–20% rotated into short-duration fixed income so the yield stream does not stop during the break, and the remainder in cash tied to a pre-specified buy plan. This range is not a uniform recommendation; the precise weights depend on horizon, volatility tolerance and personal circumstance. Most of the rebalancing should be completed across the 28–29 April sessions, rather than dumped into the final pre-holiday tape where liquidity tends to thin.
Three signals to watch at the 4 May reopen
Three signals are worth the most attention when the market reopens:
The 4 May opening gap relative to 1,853.29. A move inside ±2% (roughly 1,816–1,890) would sit squarely inside the historical range for recent 30 April holidays. A break beyond either edge signals that one of the two macro channels — the Fed or Hormuz — delivered material news during the closure.
The foreign flow action. Does the 20-session net-sell streak reverse after the break, or continue at the same pace? The VND 3,339 billion outflow on 24 April is the Q1 peak — the 4 May session will tell whether the selling has been worked out or whether there is more to come.
Real estate resilience after the VHM correction. A 5.23% single-session decline in VHM is large enough to test real-money buying from long-only holders and ETF rebalancing flows on the reopen.
These three signals together are sufficient to recalibrate the allocation frame without waiting for a second confirmation session. The strategic question is not "will the market rise or fall after the break" — the right question is "what weight lets you sleep through four holiday nights and still have capital ready to act in the first session back." Next week's data will fill in the rest.