
With HOSE boards in April heating up as the VN-Index returns to the 1,817-point zone, it is easy to forget that Q1/2026 was actually a losing quarter for equities. Look at the cold numbers instead: over the same three months, SJC gold rose more than 14%, two active equity mutual funds delivered real returns of nearly 5%, while the largest fund in the comparison group lost 7%. This article reconstructs the Q1 picture on a single ruler: percentage change from the closing price on Dec 31, 2025 to the closing price on Mar 31, 2026, benchmarked against March CPI YoY of 4.65% (about 1.15% per quarter if spread evenly).
Ranking nine investment channels in Q1/2026
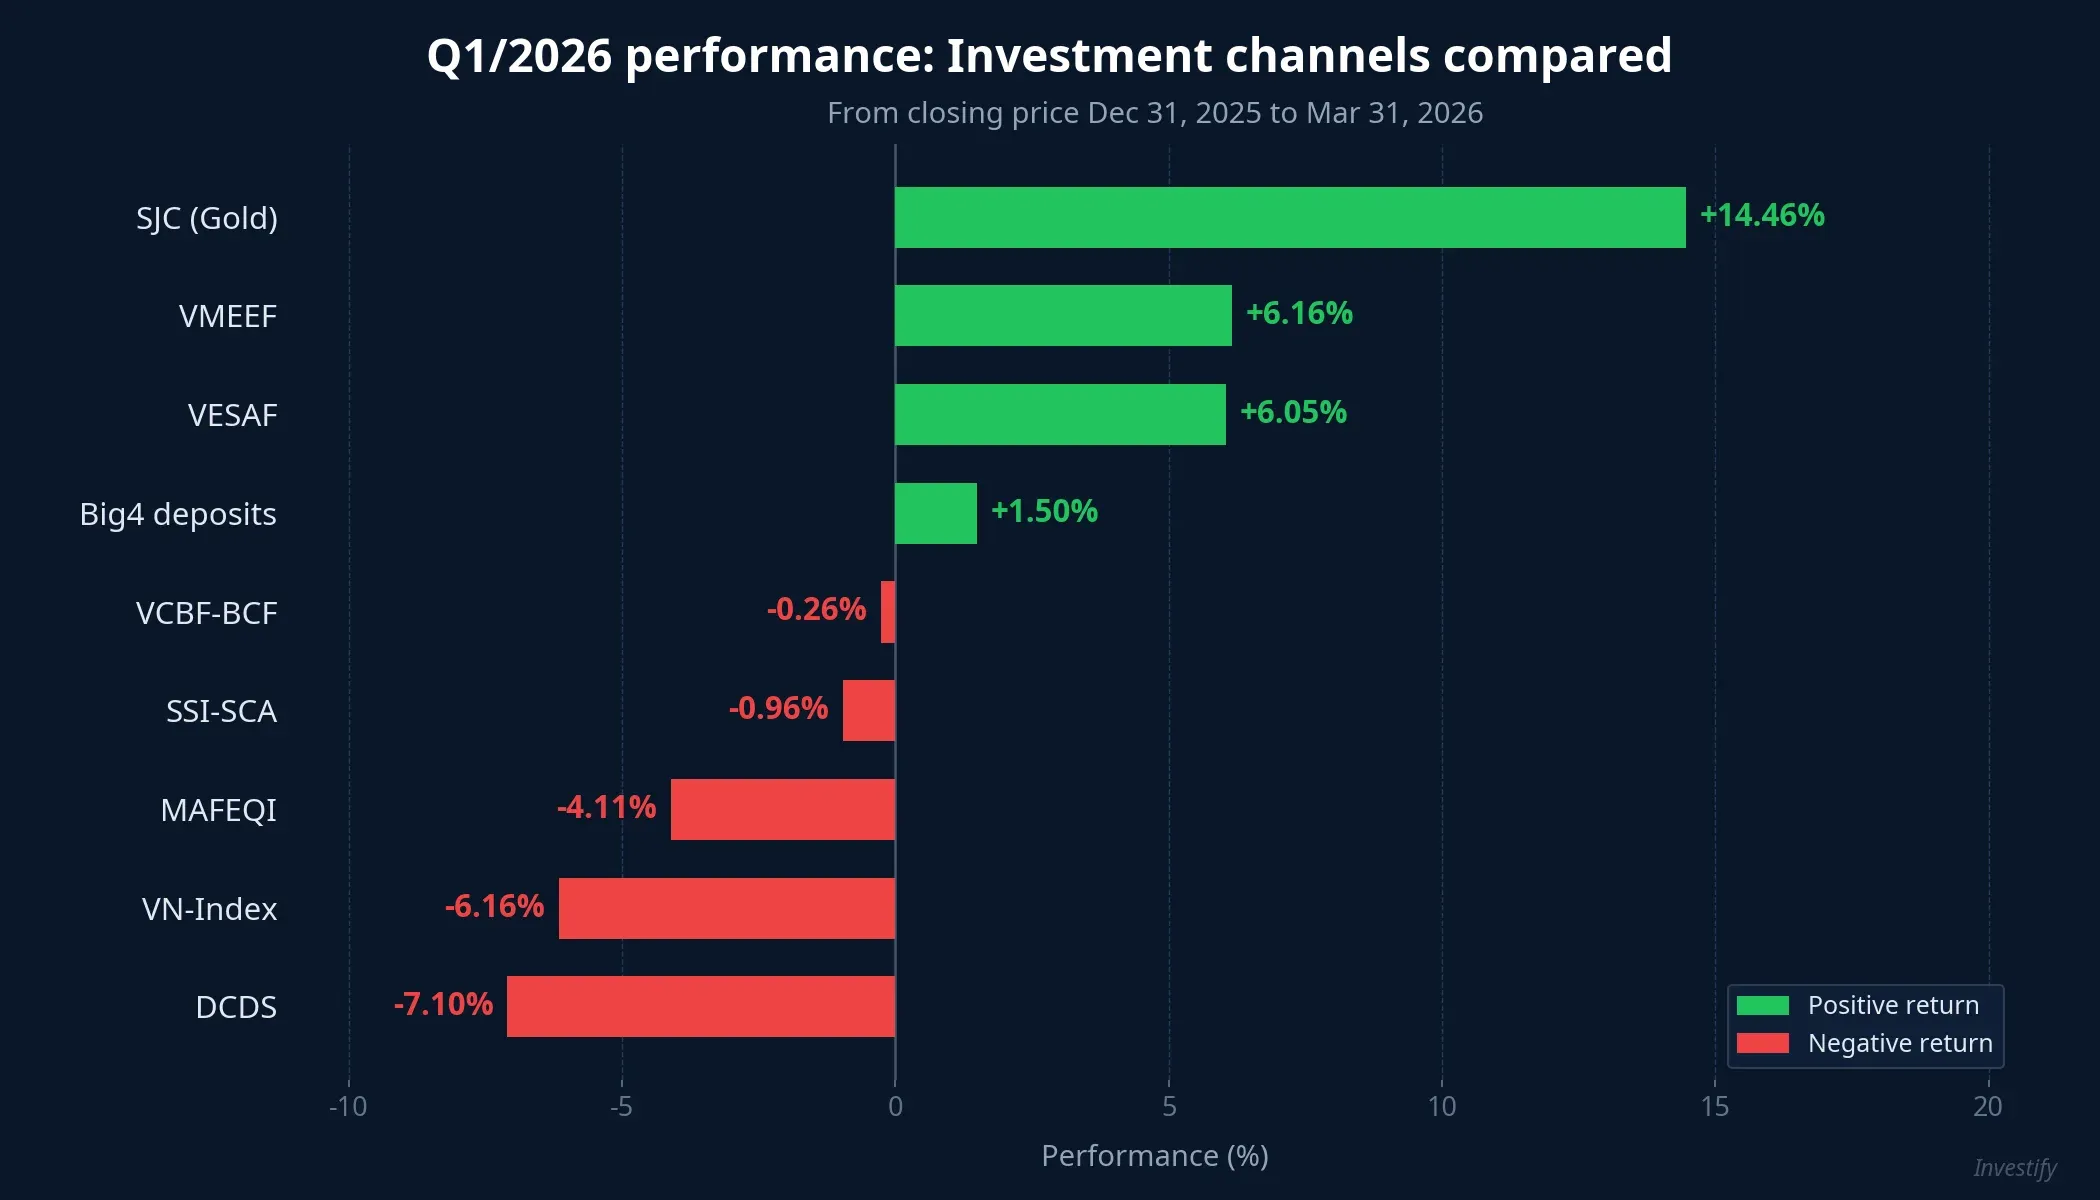
The ranking reverses a few familiar intuitions. Gold, often described as a “safe haven” this quarter, was actually the strongest performer by a wide margin of more than 8 percentage points over the next channel. The VN-Index, the asset most discussed on social media, sat near the bottom. And the most striking feature: two of six active equity mutual funds beat the VN-Index by more than 12 percentage points, while the other four could not.
This is why asking “which channel was best in Q1” is less useful than asking “which specific product inside each channel did I pick”. Within the single basket of active equity funds, the spread between best and worst was 13.26 percentage points, wider than the VN-Index’s total Q1 drawdown.
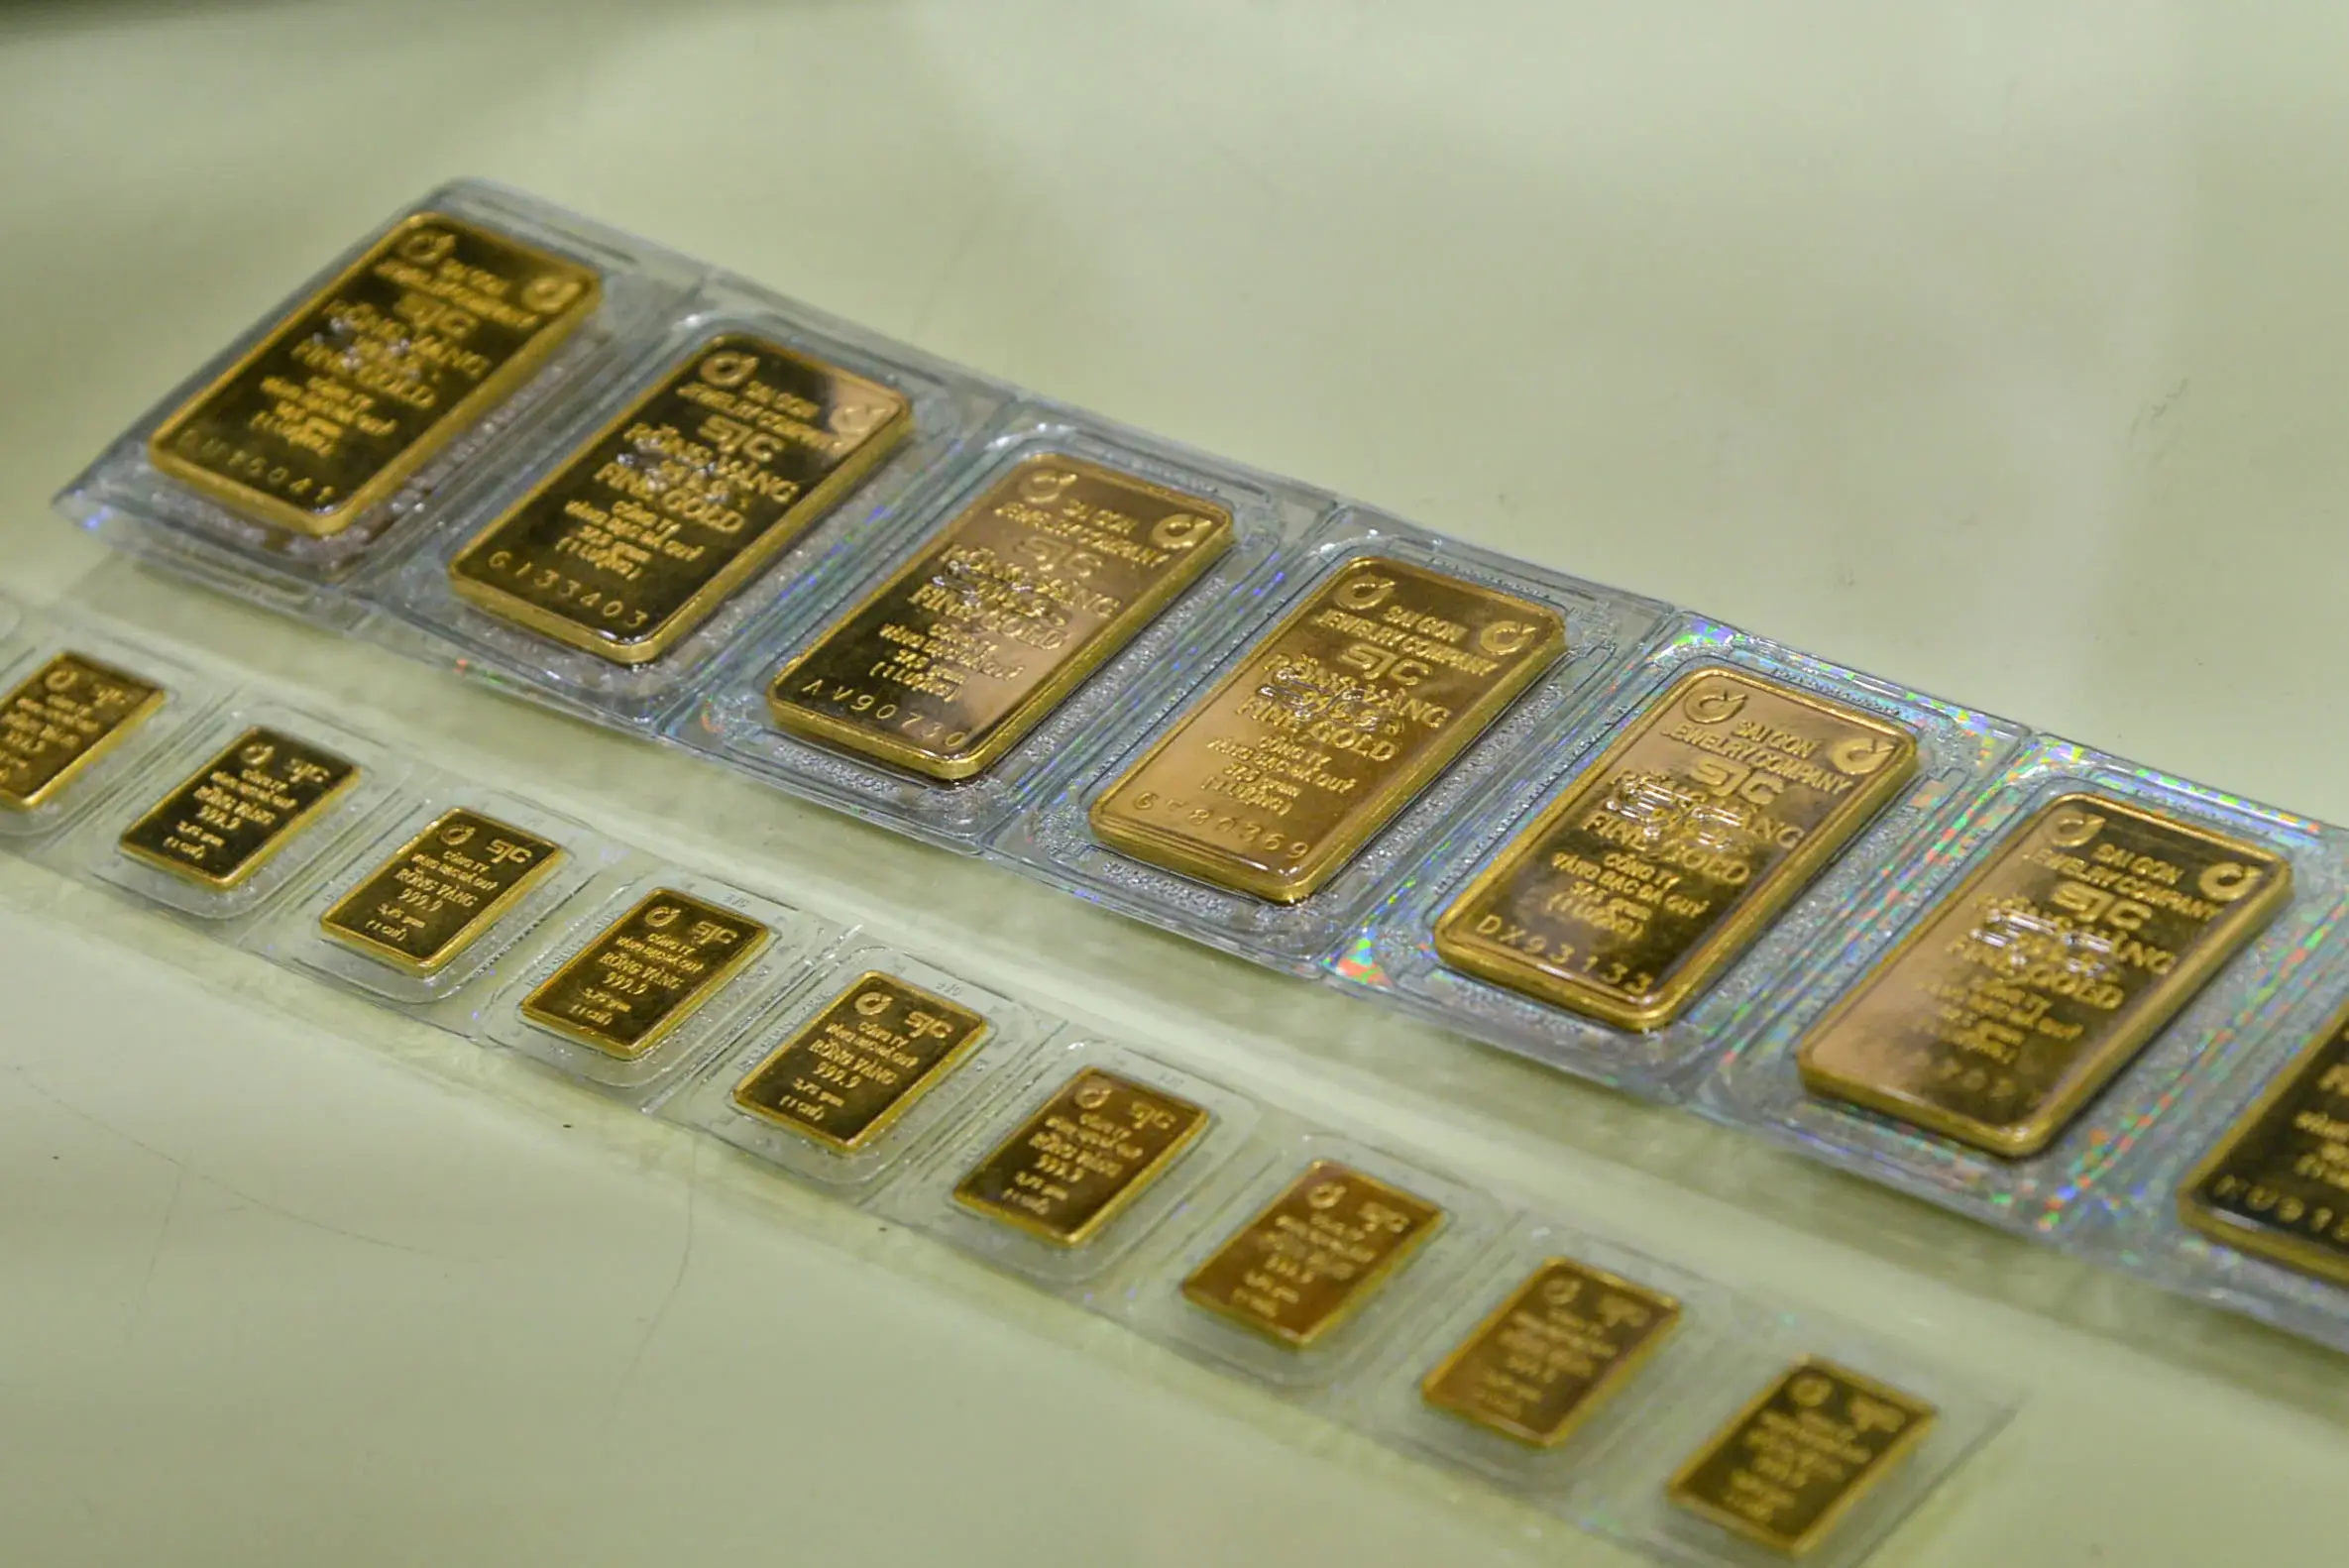
1. SJC gold: The only channel delivering double-digit real returns
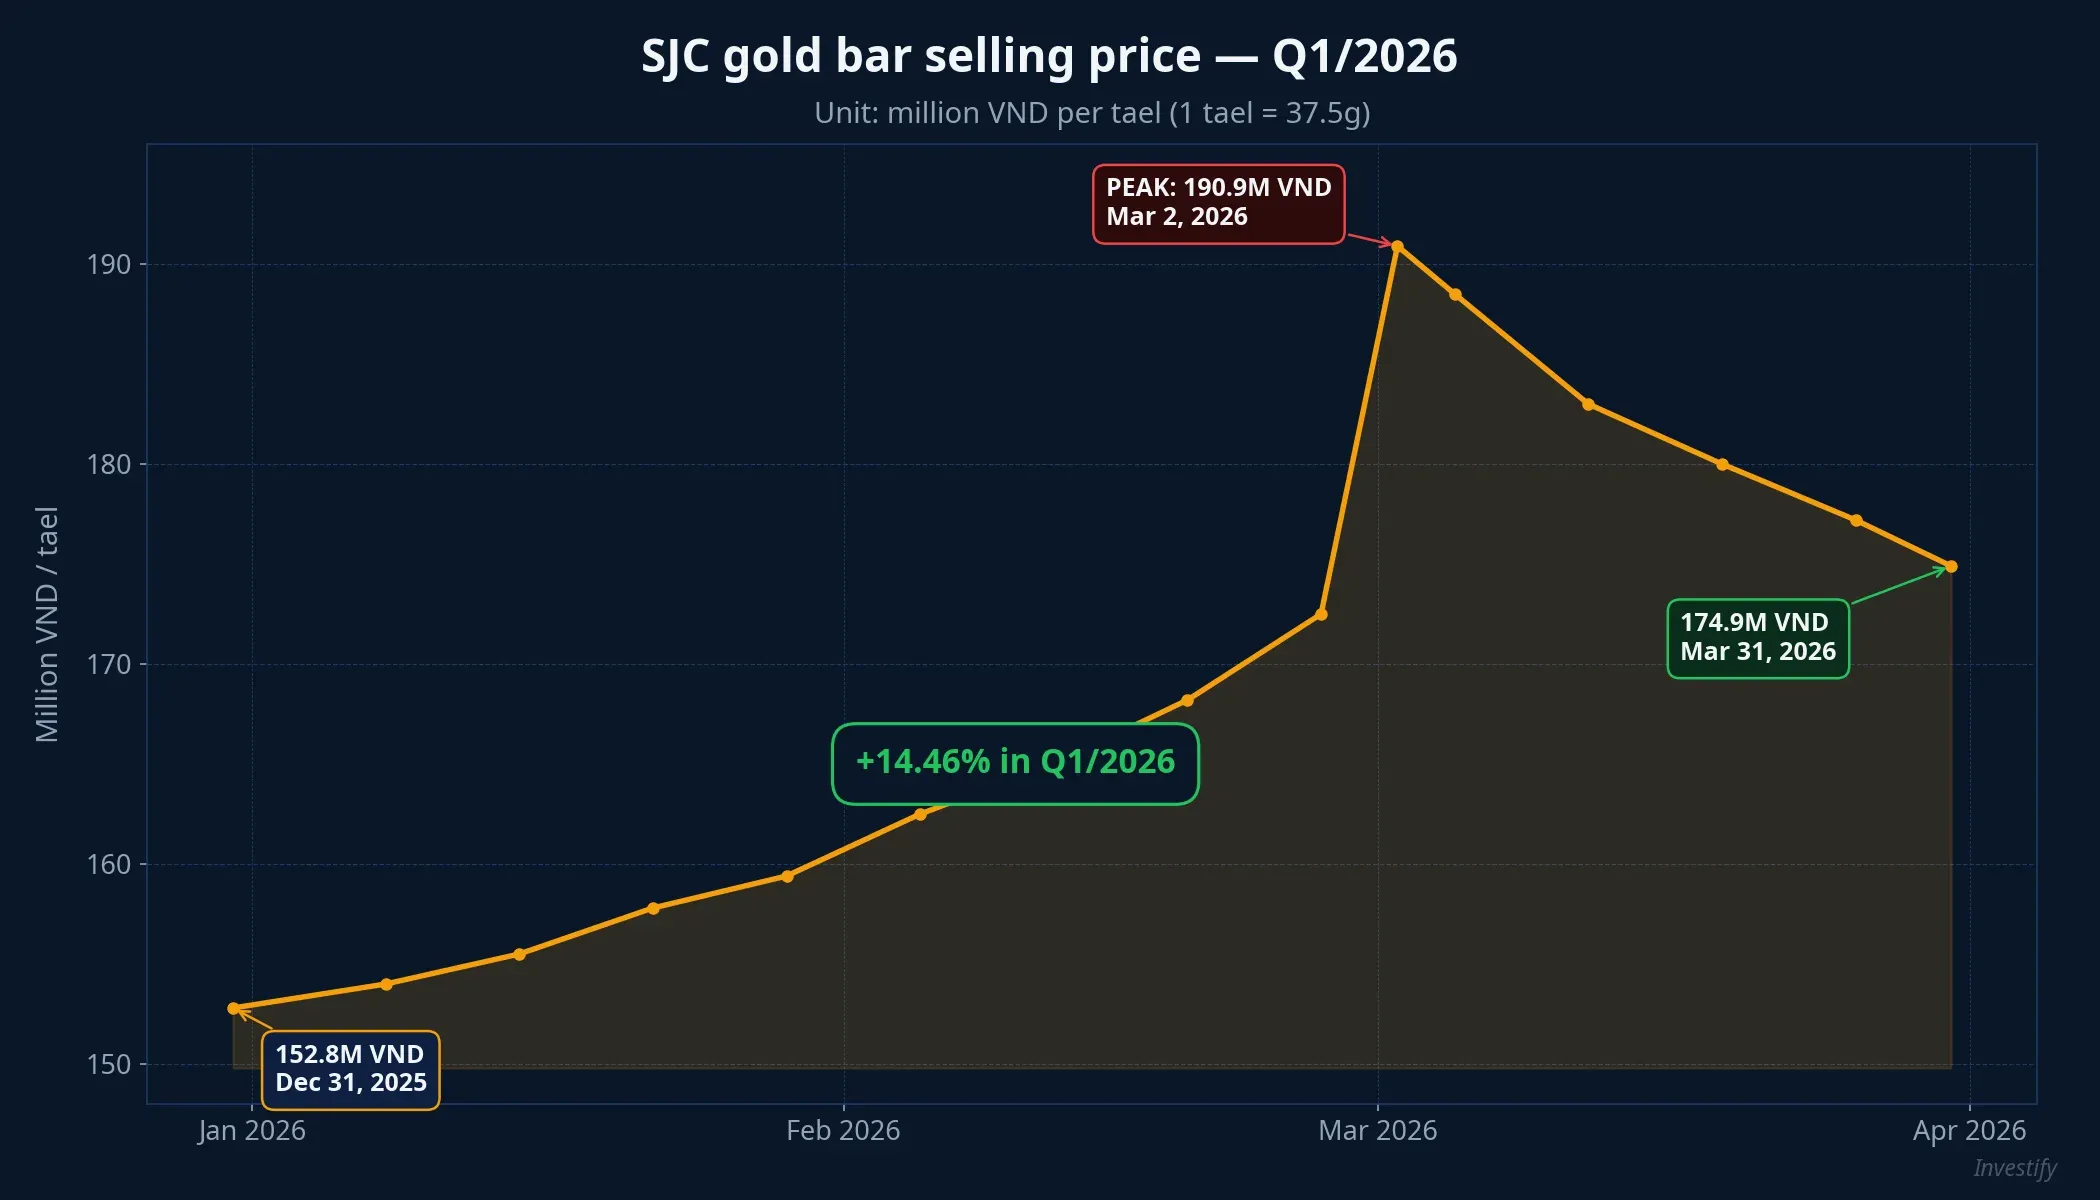
SJC gold bar selling price started the year at VND 152.8 million per tael (Dec 31, 2025) and closed Q1 at VND 174.9 million per tael (Mar 31, 2026). The 14.46% gain in three months outpaced every other channel. Notably, at the mid-March peak, SJC touched VND 190.9 million per tael before correcting into quarter-end, meaning an investor selling at the top could have booked nearly 25% in nine weeks.
Two layers supported gold in Q1/2026. The short-term layer was the Iran conflict and developments around the Strait of Hormuz, which pushed global haven demand higher. The structural layer was Decree 232/2025 breaking the SJC monopoly, which raised market expectations that domestic supply will change and the SJC premium over the world gold price may narrow.
Even after subtracting quarterly inflation of about 1.15%, gold holders still captured a real return of roughly 13.3%, far exceeding every other channel in the ranking. It must be stressed, however, that this is a return from a highly atypical quarter, not a “structural” feature of gold. Over the past twelve months, SJC has seen multiple sharp reversals, and April has already delivered a single-day 2% drop. Q1/2026’s dominance does not guarantee the pattern repeats.
2. VN-Index: A losing quarter masked by April’s bounce
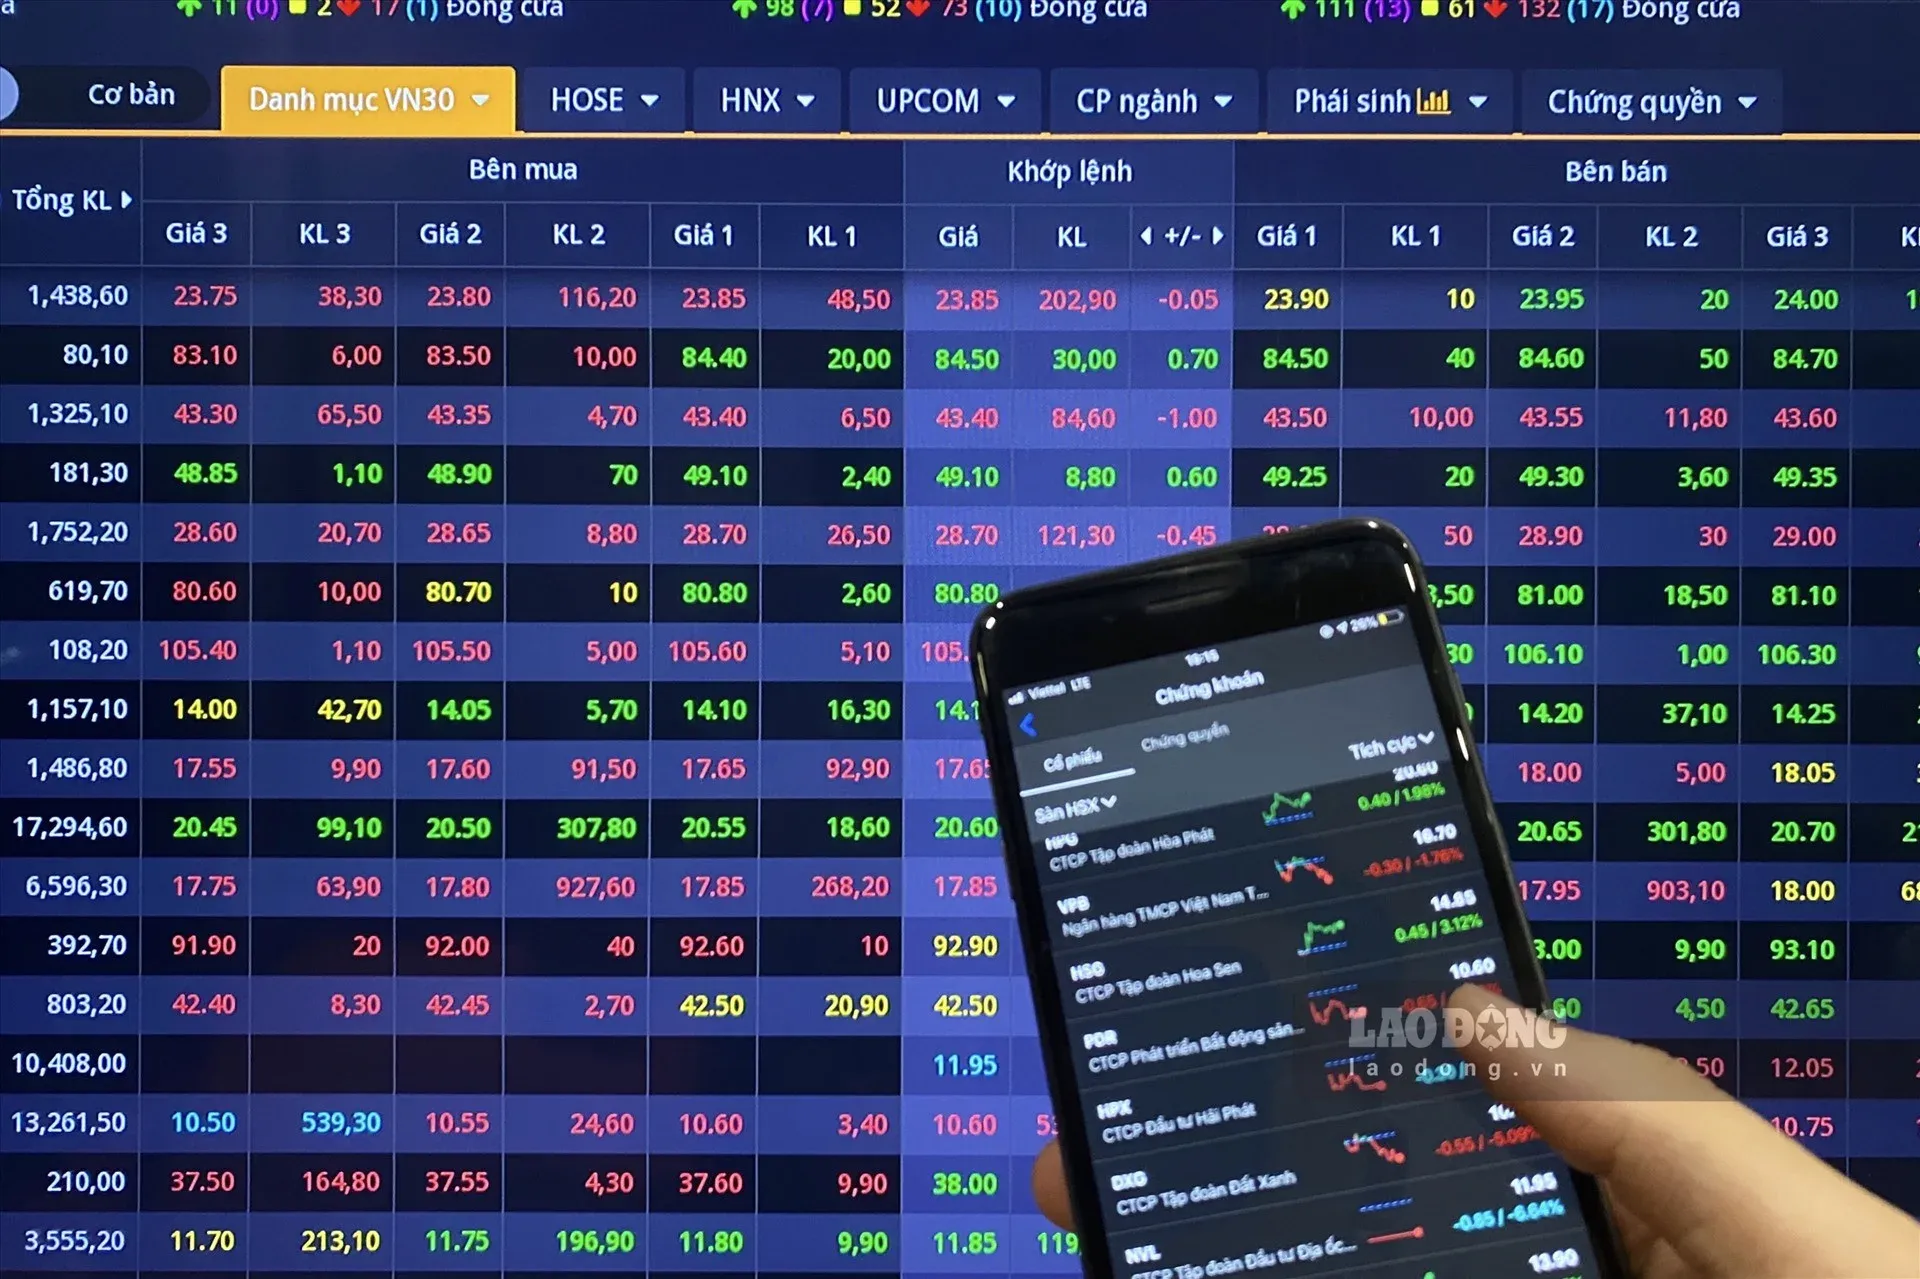
The VN-Index opened 2026 at 1,784.49 (Dec 31, 2025) and closed Q1 at 1,674.49 (Mar 31, 2026), a drop of 6.16%. Q1 saw several violent sessions: Mar 9 fell 6.51% and Mar 23 fell 3.44%. Sentiment was driven by geopolitical conflict and mixed signals on foreign capital flows.
After Mar 31, the market staged a notable rebound. In the first four weeks of April alone, the VN-Index rose from 1,674 to 1,817, or +8.55%. That recovery is exactly what makes many retail investors feel the market has “clawed back” the bad news. In reality, year-to-date the VN-Index is only breakeven, while gold is already +14% and the two winning mutual funds are +6%.
Put differently, April may be a different chapter, but the Q1 ruler is still the Q1 ruler: in the first three months of 2026, Vietnam’s main equity index was one of the three worst-performing channels in the ranking.
3. Active equity mutual funds: A 13.26-point dispersion
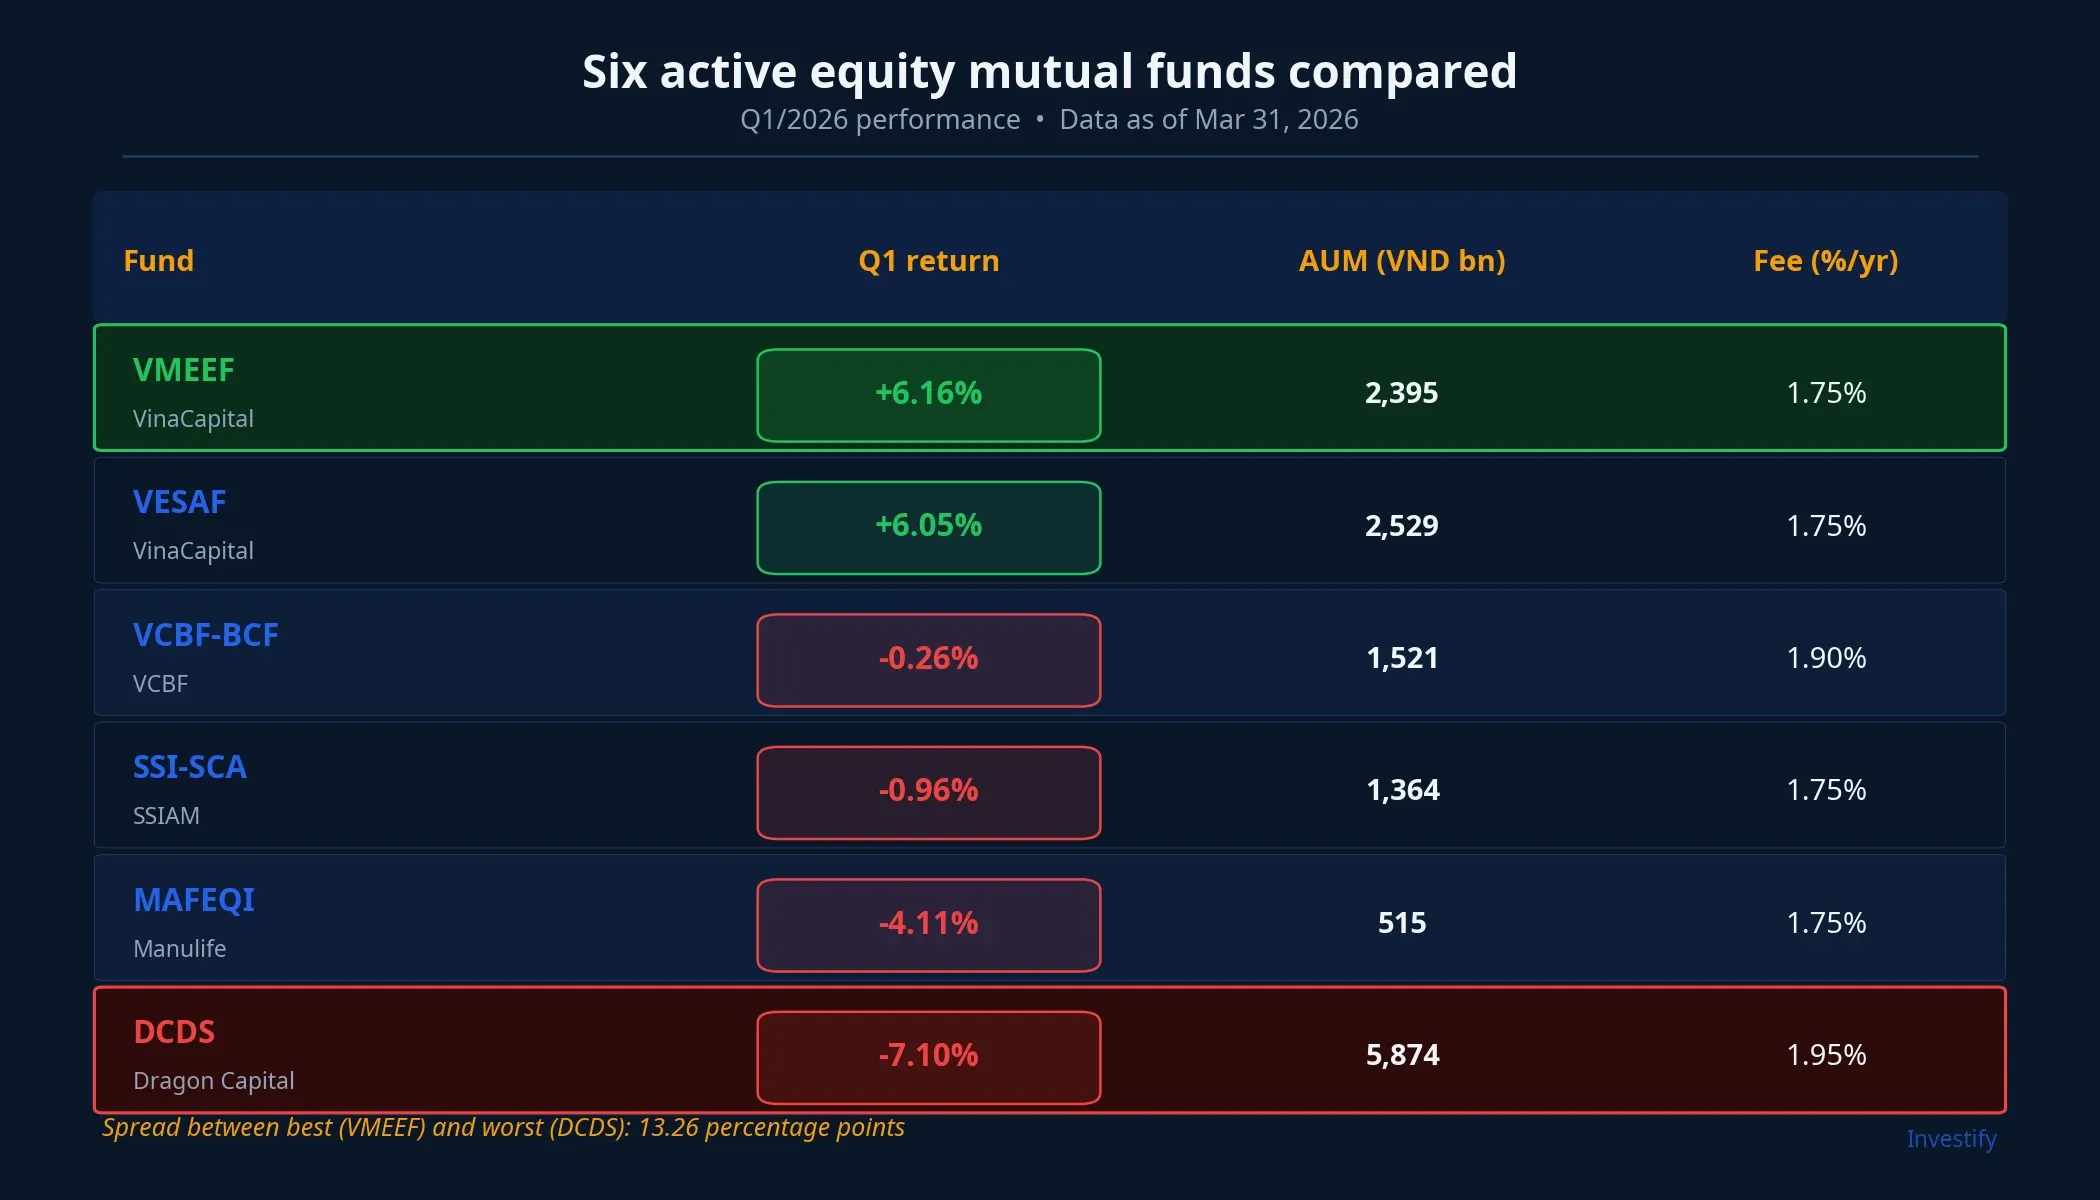
This is the most interesting part of the story for retail investors. The six large active equity mutual funds included in the comparison produced extremely dispersed results: VMEEF (VinaCapital) led at +6.16%, VESAF (VinaCapital) was second at +6.05%. The middle group — VCBF-BCF (-0.26%) and SSI-SCA (-0.96%) — was essentially flat. The bottom group consisted of Manulife’s MAFEQI (-4.11%) and Dragon Capital’s DCDS (-7.10%), with DCDS being the largest fund in the group by AUM at VND 5,874 billion.
The spread between the best fund (VMEEF +6.16%) and the worst (DCDS -7.10%) was 13.26 percentage points in a single quarter, despite both investing in the Vietnamese equity market and facing the same -6.16% VN-Index. Within the same “market”, an investor could either gain 6% or lose 7% depending on which fund they picked.
Dispersion typically comes from three sources: sector weightings, cash level for defense, and turnover ability when the market reverses. Q1/2026 had an unusual feature in Vietnam — the index dropped, yet dispersion across stocks was very high, with many mid-caps and sectors outside the VN30 still holding gains. Funds tracking close to VN-Index weights (typically large funds, constrained by liquidity) lost; selective funds focused on growth stocks outside the blue-chip basket won.
One point cannot be ignored: fees. VMEEF and VESAF both charge 1.75%/year, while DCDS charges 1.95%/year. Looking at fees alone, investors might think all funds are “about the same cost”, but one quarter is enough to show that a 1.75-1.95%/year fee is only meaningful in the context of actual portfolio outcomes. DCDS is the largest fund by AUM, the most expensive by fee, and the worst performer in Q1/2026.
4. Big4 savings: A steady anchor, not a winner against gold or top funds
As of end-Q1/2026, 12-month deposit rates at the Big4 state-owned banks stood at Vietcombank 5.9%, VietinBank 5.9%, Agribank 6.1% and BIDV 6.8%.DNSE Converted to three months, long-tenor depositors earned about 1.5% within the quarter, or roughly 0.4% real after quarterly inflation.
The number is modest compared to gold or the two winning funds. Yet Big4 savings is the only channel in the ranking with essentially zero volatility — and that is exactly what it sells. In a quarter where the VN-Index dropped 6.51% in one session and SJC fell 4.10% in one day, deposits act as an “anchor” that lets the rest of the portfolio take risk. Deposit insurance of up to VND 125 million per account at the Big4 also makes this layer virtually free of counterparty risk.
Four questions investors need to answer themselves
The Q1/2026 data does not say which channel is “right” or “wrong”. It shows that each channel dominates in its own context, and asset allocation depends on four concrete questions:
- What is your horizon? Gold winning 14% in Q1 does not mean gold suits a long-term accumulator. A 6% Q1 drop in the VN-Index does not mean equities are unworthy when April has already recovered 8.5%.
- Do you have time to pick stocks? The 13.26-point gap between the best and worst fund proves that picking the right fund produces the same magnitude of return difference as picking the right stocks. For investors who do not watch the board daily, a high-quality active equity mutual fund is a reasonable channel — provided you pick the right fund and accept a 1.75-1.95%/year fee.
- Do you need a defensive layer? Big4 savings does not beat inflation by much, but its volatility is almost zero. That is the price of peace of mind, and also the condition that lets the other layers accept risk.
- Is gold a short-term or long-term position? The structural story for gold in 2026 still depends on Hormuz, the pace of Decree 232 implementation, and the upcoming national gold exchange. Q1/2026 was an atypical quarter for gold, not a normal state.
Three factors worth watching in May and June: April CPI (affects the real return of deposits and bonds), net foreign buy/sell on HOSE (affects the gap between winning and losing funds), and the SJC premium over world gold once Decree 232 is in force. No channel wins forever. The reasonable move is to understand the win/loss mechanics of each channel in each specific context, and allocate by personal goals rather than piling into whatever was “hot” in the previous quarter.