

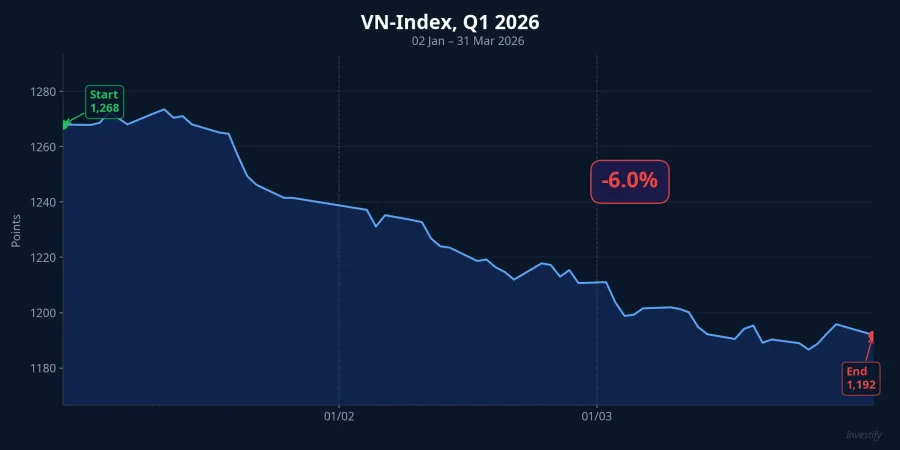
The VN-Index closed Q1 2026 down 6% from year-end 2025, but Q1 earnings reports from Vietnamese brokers did not move in one direction. As of 18 April, 30+ brokers have released financial statements, and the picture has split into two clear poles: brokers living off margin lending and brokerage fees are still booking trillion-dong profits, while those dependent on FVTPL proprietary trading are posting hundred-billion-dong losses or profit declines of more than 60% YoY.
Look at the numbers, and the story is not about scale or brand. It is about revenue structure — and this is the lens retail investors holding broker stocks need to apply before SSI, VND, FPTS, BSI and the rest of the cohort release over the next two weeks.
The winners: margin and brokerage remain cash machines
What the profitable group has in common: the bulk of revenue comes from two segments tied to margin loan balances and trading value — not directly to the direction of the VN-Index.
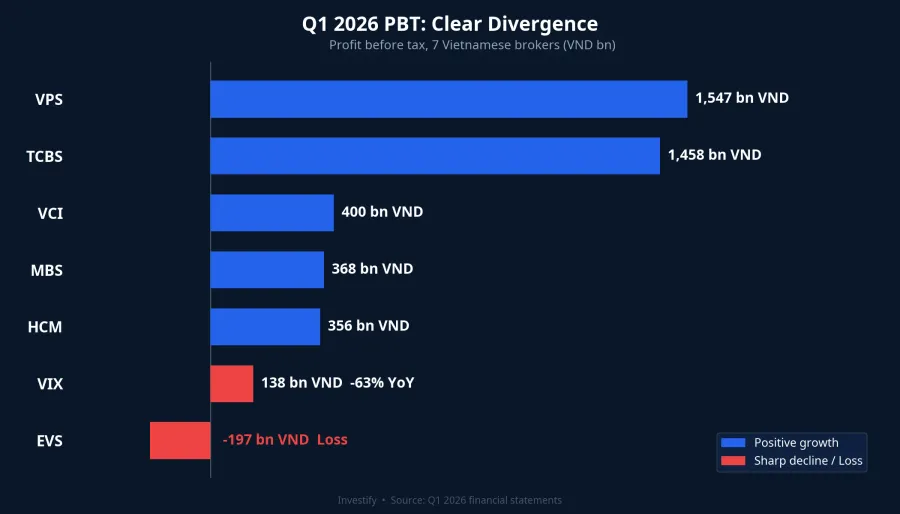
TCBS (Techcom Securities) led on growth: Q1 revenue of VND 2,783bn, up 37% YoY.TCBS Profit before tax reached VND 1,458bn, up 11% YoY.VnEconomy End-of-quarter margin loan balance hit VND 44,754bn — the largest in the industry. With a book that size, every percentage point of margin rate produces meaningful interest income, and that income stream does not erode whether the index rises or falls.
VPS retained top spot on HOSE brokerage market share in Q1 at 15.32% (up 1.04 percentage points from the previous quarter), with profit before tax of VND 1,547bn.DNSE With roughly VND 30,000bn in margin loans and massive trading flow, VPS earns steady fees regardless of market direction.
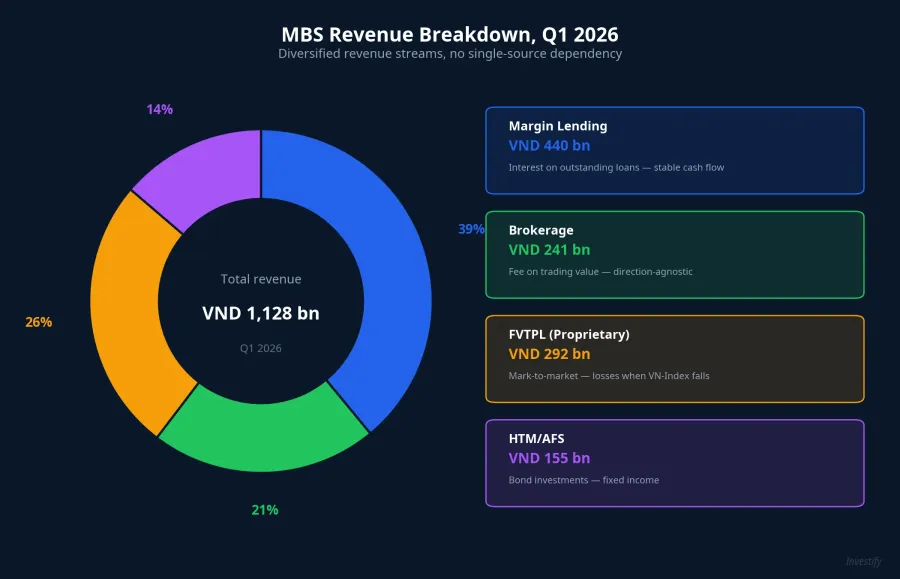
MBS is the most persuasive illustration of "structure decides performance". Operating revenue of VND 1,019bn, up 50% YoY.Baomoi The two drivers: margin interest of VND 440bn (+58% YoY) and brokerage fees of VND 241bn (+81% YoY). Profit before tax VND 368bn, after tax VND 292bn (+9% YoY).DNSE Worth noting in the filing: MBS does have an FVTPL book and that book softened in Q1, but the FVTPL scale at MBS is modest, so the two core pillars carry the whole machine.
HCM (HSC) posted Q1 revenue of VND 1,264bn and profit before tax of VND 356bn — both up 26% YoY.CafeF VCI (Vietcap) estimates Q1 profit before tax at approximately VND 400bn, up about 13% YoY.Mekong ASEAN
The common thread: even with the VN-Index down 6%, market-wide trading value and margin loan balances both still grew — and that is the revenue base this group actually lives on. When markets shake, retail investors trade more, not less, and brokerage fees rise with them. That is why top brokers print clean Q1 books in a quarter when the index fell.
The losers: when FVTPL turns from driver to drag
FVTPL (Fair Value Through Profit and Loss) covers financial assets that must be marked to market at each period end. When the VN-Index falls 6%, the equity book inside FVTPL goes negative, and the loss flows directly into the P&L — there is no accounting technique that defers it.
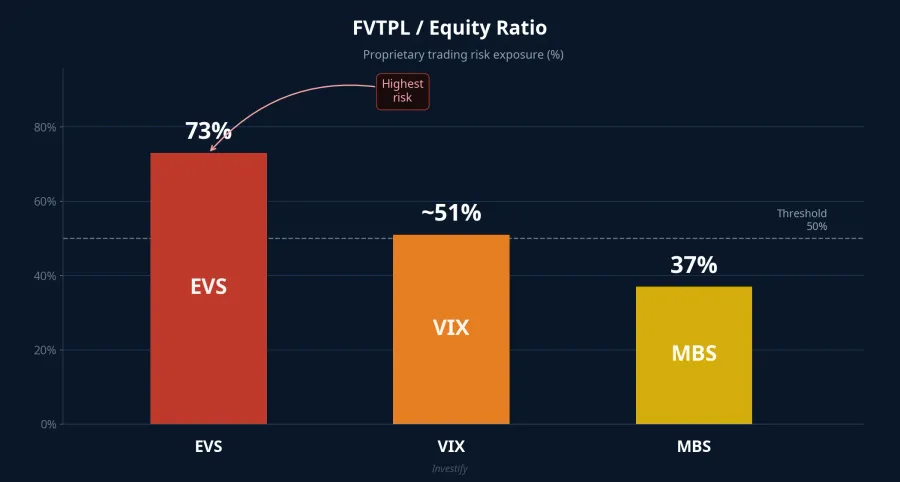
EVS (Everest Securities) was the first broker to print a hundred-billion-dong loss this earnings season. Q1 operating revenue collapsed to just over VND 8bn, down almost 91% YoY.CafeF The direct cause: FVTPL income fell from VND 75bn a year earlier to barely VND 2bn. Combined with operating expenses that ballooned to VND 188bn — three times the prior-year level — EVS posted a pre-tax loss of nearly VND 197bn and an after-tax loss of VND 157bn. The FVTPL/equity ratio at EVS runs at roughly 73%, meaning the proprietary strategy has placed more than two-thirds of equity into the book — when the market falls, P&L falls with it.
VIX (VIX Securities — not to be confused with the US VIX index) reported Q1 after-tax profit of VND 138bn, down 63% YoY and the lowest in five consecutive quarters.Vietstock The blow landed on proprietary trading: from a VND 330bn gain in Q1 2025 to a loss of nearly VND 82bn in Q1 2026 — a more-than-VND-410bn swing in one line alone. VIX was explicit in its disclosure: the cause was the decline in Vietnam's equity market.
Why one quarter, two different pictures?
Same VN-Index, down 6% — different outcomes because of different revenue structures. Each segment reacts to the market in its own way:
- Margin lending: earns a fixed interest rate on outstanding loans. A market drop can trigger margin calls, but loan balances do not shrink immediately in-period, so interest income keeps flowing.
- Brokerage: earns a fee on trading value. Up or down, volatility drags more orders through — fees keep coming.
- FVTPL proprietary trading: holds equities and bonds recorded at market value. Market falls → loss booked in the period, no way to defer into the next quarter.
Caveat: revenue structure is the primary factor, not the only one. A well-structured broker can still be eroded by an explosive rise in finance costs — VIX's Q1 finance costs were up 3.6× to nearly VND 150bn — or by an expense blow-out like EVS (3× prior year). Conversely, an FVTPL-heavy broker picking the right names can still print a good quarter. Structure explains most of the variance, not all of it.
Three numbers to read any broker's Q1 report
Before glancing at EPS or P/E on a broker stock, these three ratios tell you what the business is actually eating and where the risk sits.
Indicator 1 — Share of stable revenue. Add brokerage revenue plus margin interest, divide by total operating revenue. Above 60% indicates a stable model, largely independent of market direction. Below 30% signals heavy proprietary-trading dependence — EPS will swing with the VN-Index.
Indicator 2 — FVTPL over equity. Take FVTPL assets and divide by equity. Above 60% (EVS at 73%) flags a large "strategic leverage" bet on the proprietary book — bright green when markets rise, bright red when they fall. Below 40% (MBS at 37%) is more balanced. The 50% line is a reasonable warning threshold.
Indicator 3 — Finance-cost change. Compare finance costs in the period to the same quarter a year earlier. A spike like VIX's (3.6×) points to heavier borrowing to expand margin books or service bond coupons — profit can compress further if rates nudge higher.
The trio does not replace reading the full statement, but in a few minutes it answers the key question: is this broker living on stable cash flow, or is it betting on the market?
What to watch in the next two weeks
Over the next two weeks, SSI, VND, FPTS, BSI, Bao Viet and more brokers will publish Q1 filings. Read them with the question first: is this firm eating off stable margin and brokerage income, or is it eating off FVTPL bets? The answer determines how much to trust the headline EPS and how to value the stock in a VN-Index that is sideways or grinding lower.
Three things worth monitoring over the next fortnight: (1) the FVTPL/equity ratio at mid-cap brokers yet to report — the 50-60% range is the band to flag; (2) whether the VIX pattern of exploding finance costs repeats elsewhere; and (3) whether industry-wide margin balances keep growing or start to plateau as margin calls rise. Those three numbers will answer "which model is durable" better than brand or scale ever could.