
The big picture reveals a rare paradox in global financial markets: war erupts in the Middle East, the Strait of Hormuz is nearly blockaded, yet gold — the traditional safe-haven asset — plunges at its steepest rate in 15 years. During the March 18–20, 2026 sessions, the precious metal dropped 3.74%, 3.51%, and 3.48% respectively, bringing the weekly decline to 9.6%.CNBC
For the full month of March, gold fell from an all-time high of $5,595/oz to a low of $4,250/oz — a 23% decline, the worst since October 2008.The Middle East Insider What happened, and where are capital flows heading?
The Domino Chain: Oil Up, Gold Down
The "war makes gold fall" paradox has a clear explanation when viewed through the four-step macro reaction chain.
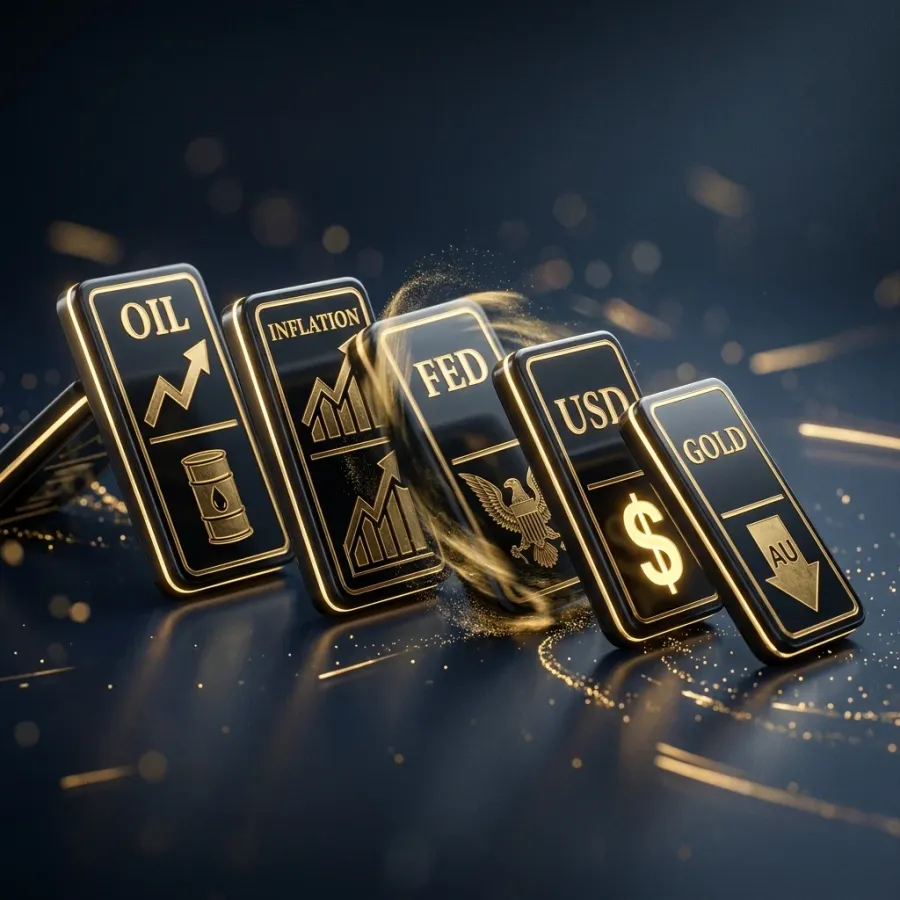
Oil explodes. Brent crude surged from around $72/barrel in late February to a peak of $112.57/barrel on March 27 — a gain of over 56% in just 5 weeks. Oil tanker traffic through the Strait of Hormuz nearly froze as the US-Iran conflict escalated, squeezing global supply.CNBC
Inflation surges. Soaring energy prices pulled transportation and production costs higher, pushing US inflation expectations upward. This is the most critical link in the domino chain, as it forced the Federal Reserve to respond.
The Fed holds its hawkish stance. At the March 18 meeting, the Fed held interest rates steady at 3.5–3.75% and raised its PCE inflation forecast to 2.7%.CNBC More notably, markets began pricing in a 52% probability that the Fed would raise rates before year-end 2026 — the first time rate-hike odds exceeded 50%.CNBC
USD strengthens, gold buckles under pressure. Higher rate expectations drove the dollar higher. The USD/VND exchange rate rose from 26,165 to 26,337 dong during March. Gold — a non-yielding asset priced in USD — became less attractive compared to US Treasuries offering elevated yields.
In other words, the Middle East war did not directly push gold prices down. But it indirectly triggered a chain reaction through the oil and inflation channels that crushed the traditional safe-haven asset.
Historic Volatility: Gold Drops 23% in March
The chart below shows gold's price action throughout March 2026. The $4,250/oz trough formed in the second week before prices staged a sharp recovery, vaulting to an all-time high of $5,595/oz by month's end.
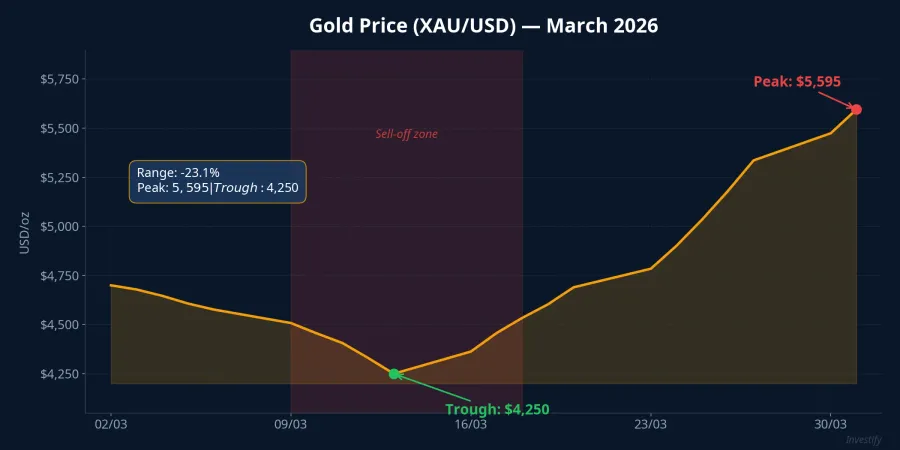
A nearly $1,350/oz swing within a single month is extremely unusual. The last time gold exhibited this level of volatility was October 2008, at the peak of the global financial crisis. This signals that the market is in a state of extreme tension, where any news — from diplomatic negotiations to inflation data — can trigger swings of hundreds of dollars.
Goldman Sachs and JPMorgan Remain Bullish Long-Term
Despite the shocking correction, the world's two largest investment banks maintain very high year-end 2026 gold price targets.
Goldman Sachs targets $5,400/oz, raised from $4,900/oz earlier this year. The bank acknowledges short-term risks still skew to the downside, but structural demand from central banks and ETFs — which have net-purchased approximately 500 tonnes of gold since early 2025 — will support prices over the medium term.Goldman Sachs
JPMorgan is even bolder with a $6,300/oz target, forecasting global central banks will buy up to 800 tonnes of gold in 2026. In a bull-case scenario, JPMorgan even mentions the possibility of gold reaching $8,000–$8,500/oz if household portfolio allocation to gold rises from 3% to 4.6%.Kitco
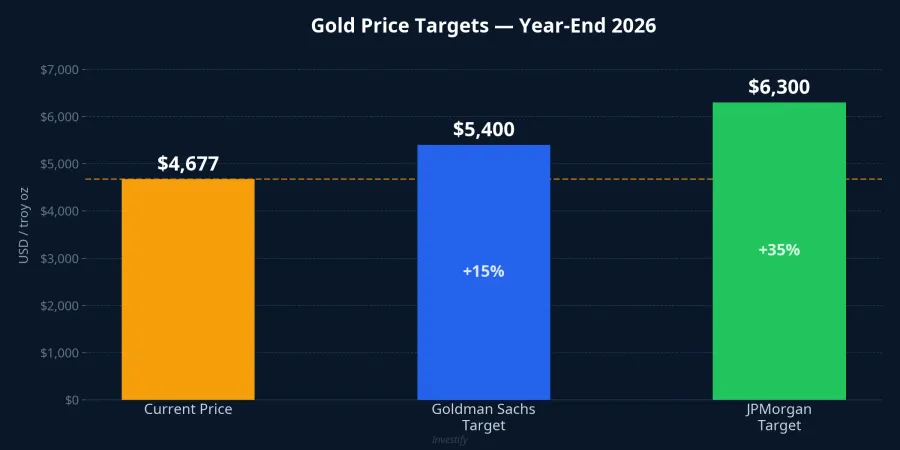
Compared to the current price of around $4,677/oz (as of April 2), both targets imply 15–35% upside from here. Capital flows are shifting clearly: central banks continue net buying, while gold ETFs record record inflows. This structural foundation is one that a short-term sell-off can hardly break.
Vietnamese Investors: SJC Gold Down Nearly 10% From Peak
In Vietnam, SJC gold was quoted at 170 million dong (buy) and 173.5 million dong (sell) on April 2, down approximately 9–9.5% from its January peak of 190.3 million dong per tael.VietnamNet On April 3, SJC prices continued to swing sharply within the 171–176.7 million dong range.
A notable point: the premium between SJC and the converted international gold price remains at 16–17%. With the global price at approximately $4,677/oz and an exchange rate of 26,337 VND/USD, the converted price is only about 148.5 million dong per tael — significantly lower than SJC's selling price. This premium reflects domestic supply-demand dynamics and gold bar import regulations, and represents a risk factor investors must weigh in their buy-sell decisions.
Three Scenarios for April 2026
Bullish scenario: Middle East negotiations progress, oil cools down, and the Fed softens its hawkish tone. Gold recovers to the $4,800–$5,000/oz range; SJC could return above 180 million dong.
Bearish scenario: Oil continues rising, the Fed holds or raises rates. Gold may retest the $4,250/oz low; SJC retreats below 165 million dong.
Neutral scenario: Gold ranges between $4,500–$4,800/oz amid a lack of new catalysts; SJC trades sideways around 170–175 million dong.
The Right Strategy for Now
For those holding SJC gold, this is not the time to panic sell. The 23% March correction occurred against a long-term uptrend, and both Goldman Sachs and JPMorgan see significantly higher prices by year-end. However, rushing to "catch the bottom" is equally unwise when the Fed has yet to clearly signal rate cuts, and the Middle East conflict could escalate at any moment.
The most appropriate strategy is to scale into positions: if you want to accumulate, buy in small increments at different price levels rather than going all-in at once. Monitor three key variables that will determine gold's direction in April: Brent crude prices, messaging from the Fed, and developments in Iran negotiations. These are the three factors every investor needs to understand before making a decision.